The election campaign has now formally begun, and with it we launch our special election centre
Traditionally, most of the detailed polling data is something that political parties have studied and kept behind closed doors. At YouGov, we believe that the more data that is out there in the public domain, the better decisions everyone will make.
The new elections site shares the wealth of data that YouGov collects and analyses about the British population with anyone who is interested. What is more, we are using the latest techniques to glean more from the data than has ever been attempted before. We believe the information will help people, whatever their political outlook, to understand where people stand on the big issues and how it might feed into the democratic process on May 7th.

The Nowcast and the Forecast – FAQs
- What’s the difference between a Nowcast and a Forecast?
- What’s the difference between a ‘model’ and a regular YouGov poll?
- How is the Nowcast calculated?
- Why are your numbers different from other forecasting groups that are using YouGov data?
- Why are you doing these experiments?
- Can I take part?
- Doesn't open participation skew the results?
- Why is it all just politics?
Guide to other sections of the YouGov Election Centre
The Nowcast and the Forecast – FAQs
What’s the difference between a Nowcast and a Forecast?
It’s a common misconception about opinion polls that they are supposed to be predictions of the final result. Actually, they are a reflection of the current state of play – what people are telling us right now. Of course, people often say one thing and then change their mind once it comes nearer to election day – that’s the whole point of an election campaign.
For this website we’ve attempted to make this distinction clear. The Nowcast is our best estimate of what the data suggests today. Unlike a forecast, it does not include any hunches, educated guesswork, or predictions of what movement there might be before or on election day.
It’s a look at the state of the campaign right now, before many people have even woken up to the decision they will make.
What’s the difference between a ‘model’ and a regular YouGov poll?
A 'model' is a systematic way of applying data more broadly than simply measuring first-hand. If we survey a large representative sample in one constituency, we can be pretty sure we are close to measuring voting intention there accurately. But to do a daily updated full poll of 1,000 people in each constituency would obviously not be feasible! Instead we have conducted over 150,000 interviews across the country, and update it daily with 5,000 more, and observe shifts across demographics and different groups of people as well as local variations.
The 'model' is the mathematical formula we use to do that, which is adjusted as we learn more about how well it is working; the ‘nowcast’ is the individual application of that formula to the latest data across all the constituencies.
How is the Nowcast calculated?
Our Nowcast is based on a sophisticated statistical model that combines the respondents we have in each seat with modelled observations from similar types of people across the country. In maths-speak, it is a hierarchichal Bayesian model using multilevel regression post-stratification, and was originally developed by Professor Andrew Gelman of Columbia University and was extended and applied by YouGov’s Chief Scientist Professor Doug Rivers of Stanford University.
The model uses specially collected data from over 150,000 different individuals across the UK. It will be supplemented by c5,000 new interviews every day of the campaign, and will be updated most days until the election.
Important note: the model is partly based on national observations; there are some hyperlocal considerations it will not be sensitive to. In five constituencies - Clacton, Rochester and Strood, Bradford West, Buckingham and South Thanet - we are not using the model because of these particular considerations. There may be other local oddities elsewhere that we might overwrite with smart guesses but prefer to leave without intervention. As with all models, we know a proportion of our nowcasts are wrong but we can never be sure which ones, and we believe in aggregate they are as good as we can make them!
Why are your numbers different from other forecasting groups that are using YouGov data?
We have shared anonymised case-level standard voting intention data with a number of our friends in the academic world, who are using them to produce seat by seat forecasts. However there are two key differences with their work.
First, the other groups are using the standard voting data question that we publish every day. In the past six weeks, we have collected a special two-part voting intention question where we specifically prompt respondents to think about their own constituency: it has proven in the past to be better at teasing out local tactical voting. We have over 150,000 responses to this question that no other groups have seen.
Second, most of the other models you will see have an element of forecasting in them – assumptions about late swings, predicted incumbency factors and so on. We have steered clear of this to keep it a true 'nowcast'.
Why are you doing these experiments?
YouGov started as an innovation: we were the first company in the world to use online to produce regular reliable accurate election polling. We came along at a time – the year was 2000 – when polling had become stuck in the mud of outdated methodologies and had lost its reputation for accuracy. We still consider ourselves scientists and that is why we must experiment. We clearly differentiate between new experimental techniques and older trusted methodologies.
It is the mission of YouGov to use public participation to create public value, and we want to produce as much illumination as possible. With more information shared, people can make better decisions. That is why we will keep innovating and experimenting.
Can I take part?
You can join the panel and take part at any time. We'd love you to. Click here!
Doesn't open participation skew the results?
We carefully record when and how someone joins us and track the data given (by computer, not by individual humans – your data is anonymised!) We scan for anomalies in our data and adjust as necessary to maintain confidence in the reliability of our results. It has always been a core strength of YouGov's methodology to remain vigilant on the representativity of our membership and adjust for any observable panel effects.
Why is it all just politics?
Politics is just a part of what we do. We conduct a huge range of research, all of it intended to improve the way organisations, companies and creatives can better serve their customers, audiences and stakeholders. We cover entertainment, technology and consumer matters. It's all worthwhile, turning public participation into public value, and we try to make it fun!
Guide to other sections of the Election Site
Live View
Member opinions
Every day members of YouGov’s 600,000 strong UK panel share thousands of opinions with us on everything from brands to celebrities to politicians. As the group is specially recruited to represent the huge range of demographics and viewpoints found in the UK, it can be revealing to come and see what normal people are talking and thinking about today in your area and across the country. Hint: it’s not all about politics!
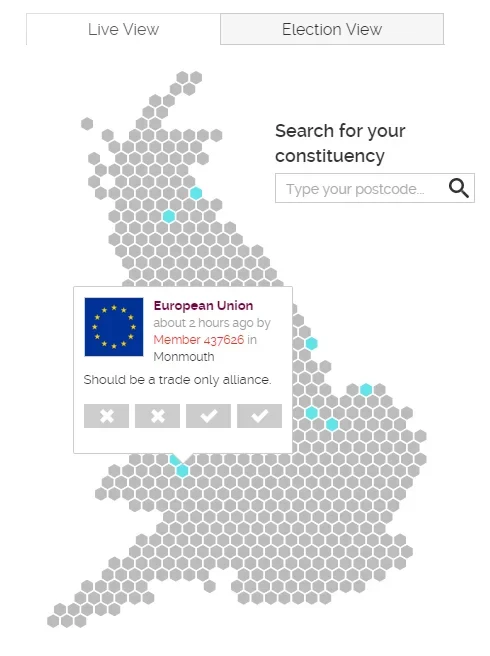
Join in by voting on whether you agree or disagree, and sign up to start contributing your own opinions straight away.
Live Poll
We’re trying a new experiment for this election season: live polling. During a campaign the issues move so fast, we want to be able to gauge reaction within hours, not wait to the next day. So every day we’ll be putting the issue of the day on the front page and getting a good steer as to what the final result will be straight away, but publishing the unweighted results as they come in.
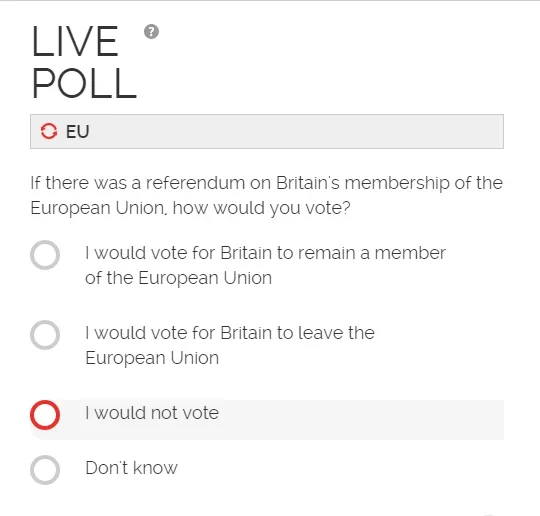
The final weighted percentages will be uploaded at 6pm each day. They will be taken from only answers given by proactively sampled panel members running through a YouGov survey, to remove any chance of the result being pushed about.
Election View
Vote share
Every day we publish a nationally representative 2,000 sample poll showing the national vote share of the parties. This is how people say they will vote today, taken as a percentage of the country. The ‘change over time’ tab allows you to browse over all the polls since the last election and see the shape of the changes we have observed. The trend line is a 24 period trend, which smoothes out much of the inevitable noise from the margin of error on a 2,000 sample.
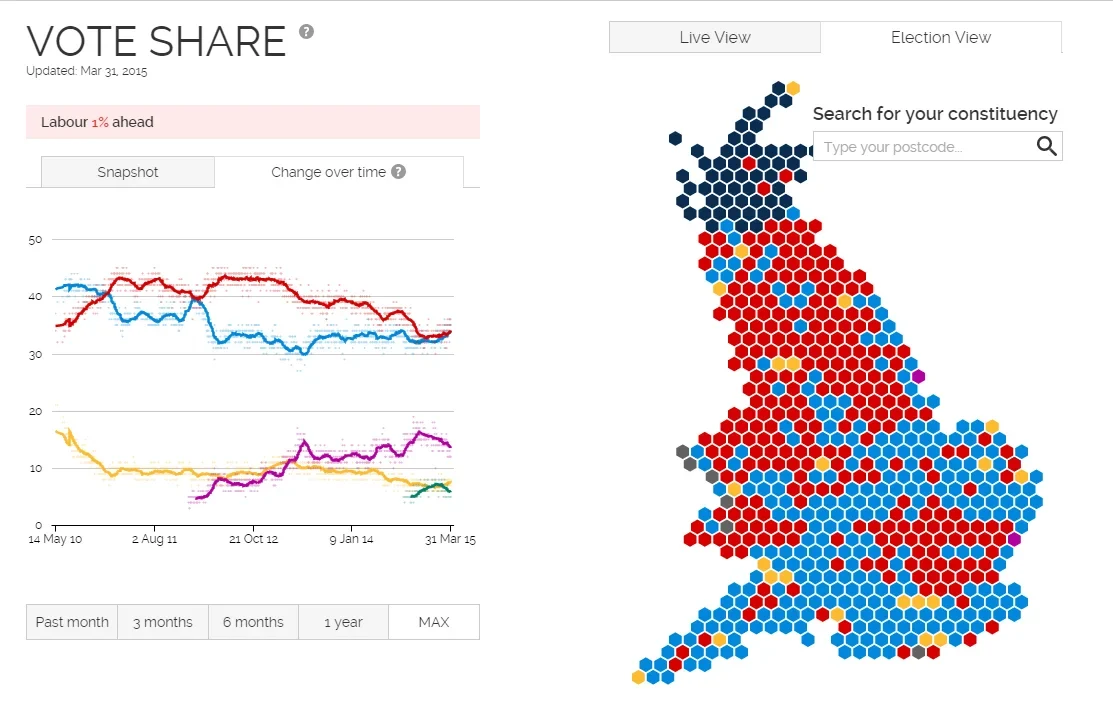
Because of our ‘first past the post’ system, the geographic distribution of support for parties makes a huge difference to the number of MPs they end up sending to Westminster. So we show the seat forecasts in a different section.
The Forecast
At YouGov we also have the benefit of some of the world’s leading observers of British politics and polls. In his forecast – which will be updated every week until election day – YouGov President Peter Kellner looks at the latest polling data, as well as the state of the campaign and observations from past elections, to share his best guess of what he thinks the result will actually be when all the votes are counted.
Constituency Pages
Demographics
We’ve gathered some key demographic data about each constituency to show how each compares to the region and the country as a whole. Click on the area to drill down into more detail. Flick between the tabs to compare to the region or the whole UK.
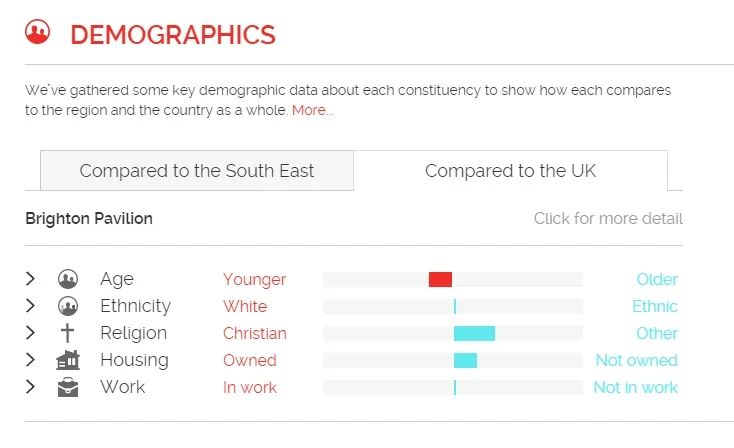
All this data is from the last census in 2011.
Issues
As part of the detailed YouGov Profile, we ask each of our members to share their position on the 50 biggest issues facing the country. Each question is carefully designed to fall on a five point scale, roughly from Left to Right. Using this standardised dataset we can score groups compared to the rest of the country to see whether they are broadly to the left or right of average on the different issues.
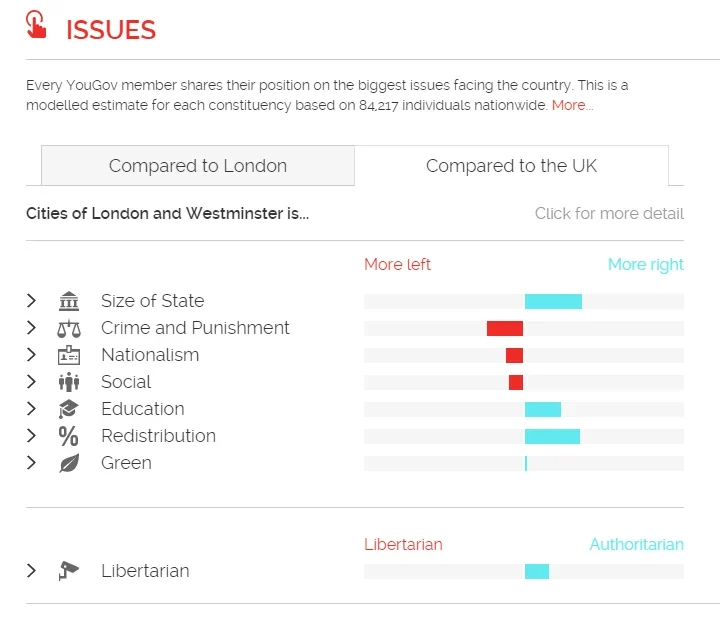
A total of 84,217 YouGov members across the country took part in this issues dataset. Using the same statistical modelling that we use for the Nowcast and for the Question of the Day, we have estimated the position of each constituency on all these issues.
Of course no question wording is perfect, and whole PhDs have been written on the problems of defining Left and Right, but we’ve done our best to capture the issues as fairly as possible.
Click on an issue area to drill down into more detail, click on an individual issue to see the question wording and exact results.
Profile
As we announced in January, we are using our amazing new product YouGov Profiles to produce a profile of the people in each constituency. For each constituency we show the voters’ top celebrities, top TV programmes watched in the past 12 months and an overview of their media habits. It’s the sort of information that is used in the commercial world to shape advertising campaigns, but for this election we are sharing it freely with anyone who is interested.
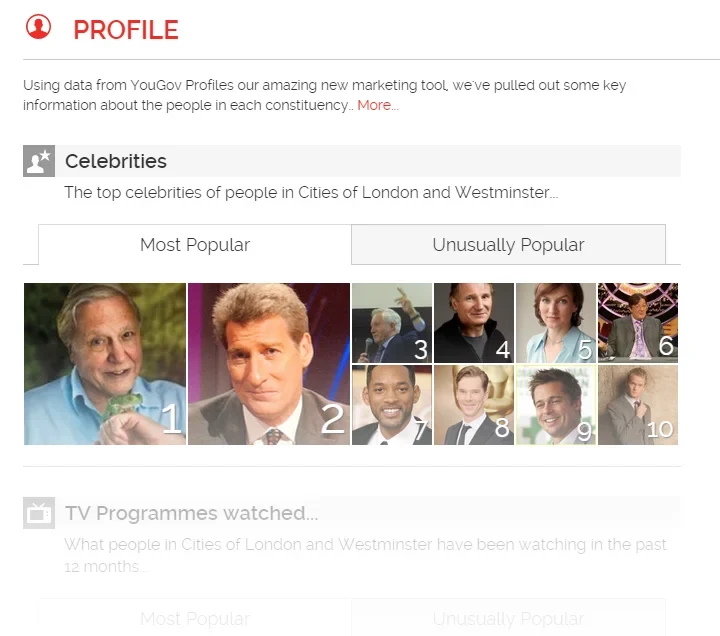
Note how for each part of the profile you can tab between ‘most popular’ (the top ranking items by absolute percentage) and ‘unusually popular’ (the items that score particularly highly in this constituency compared to the rest of the country).