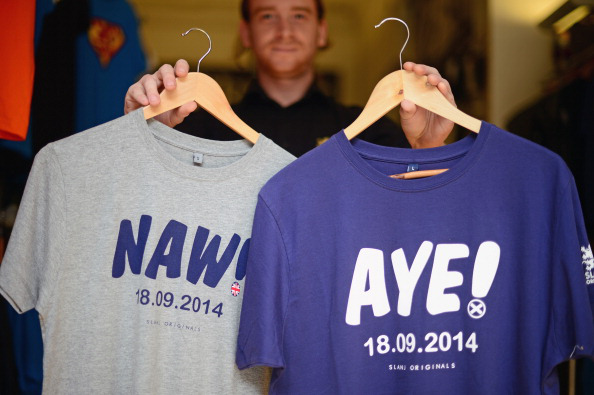

While YouGov, TNS and Ipsos MORI have recorded decisive verdicts in favour of the Union, ICM, Survation and Panelbase say the race is much closer. What is going on?
YouGov’s latest survey, for The Times, shows that a large majority of Scots intend to reject independence in the referendum on September 18. Among those who take sides, 39% intend voting Yes and 61% No. TNS and Ipsos MORI have recorded similarly decisive verdicts in recent weeks.
However, ICM (45% Yes, 55% No), Survation (47%-53%) and Panelbase (48%-52%) say the race is much closer. What is going on?
Of course, any one survey is subject to a margin of error. In elections and referendums, when small statistical variations can make a big political difference, care must be taken in interpreting the data. One option is to look at more than one poll – either by different companies at the same time or by the same company at different times.
Want to receive Peter Kellner's commentaries by email? Subscribe here
The following table shows how each company conducting regular surveys has recorded the Yes percentage over the past five months (after excluding ‘don’t knows’, so that Yes+No adds to 100.)
| Company | No. of polls | Yes %, excluding don't knows | |
|---|---|---|---|
Average | Range | ||
YouGov | 5 | 41 | 39-42 |
TNS | 5 | 41 | 40-41 |
ICM | 5 | 45 | 42-48 |
Panelbase | 5 | 46 | 46-48 |
Survation | 6 | 45 | 44-47 |
Two points stand out. The first is that four of the five companies tell a story of little change. Apart from ICM, whose Yes score has fluctuated across a six-point range, the variations within each series can easily be explained by sampling fluctuations. There is no evidence of any trend in recent months towards either Yes or No, following a slight rise in Yes support either side of Christmas.
Secondly, however, there is no agreement between the companies on the level of support for Yes or No. According to YouGov and TNS, No has been ahead by a large and consistent margin of around 18 points, 59% - 41%. But if we had only Survation and Panelbase polls to go on, we would conclude that the gap is a far narrower 8 points, 54% - 46%. The first scenario points toward a large No majority, while the second scenario offers the prospect of a close race.
If each company had done just one poll, then their differences might just about be explained by random sampling fluctuations around a mid-point of 43-44%. However, we can rule out this explanation. The number of surveys is too large, and the consistency of the results of four of the five companies is too great. The differences are systematic. The challenge is to explain these differences.
Fortunately, Survation’s latest survey contains some fascinating data that help to explain what is going on. What follows is based on the 33 pages of the tables that Survation originally posted on its website. (The current, shorter version on its site can be viewed here.) As I shall argue, some of the data in original tables raise questions about Survation’s methods. My analysis relates to a single poll by a single company; but the general methods Survation use are also employed by some of the companies that produce similar results.
The uses and dangers of recalled past voting
To make sense of Survation’s figures, let’s start with its basic approach. Like all polling companies, it adjusts its raw data to match its sample to the electorate as a whole. In Survation’s case, this weighting process takes account of age, gender and region. Like most companies it also asks people how they voted in the last elections to the Scottish parliament in 2011, and adjusts its raw numbers so that the published figures match the result of that election. This is all perfectly normal.
The problem is this. Past vote weighting can be useful, but it is also risky. In Scotland, attitudes to independence are closely linked to party allegiance: committed SNP voters overwhelmingly say they will vote Yes, while most Labour, Conservative and Liberal Democrat loyalists plan to vote No. So if the sample, after being weighted, has the right number of supporters of each party, it should be reasonably accurate in telling us how voters divide between Yes and No.
On the other hand, if the party mix is badly wrong – or if the sample contains the wrong combination of committed party loyalists and wavering voters – then the Yes and No percentages are also likely to be wrong.
Much, then, rides on people remembering accurately how they voted in the past. Unfortunately, they don’t always do so. According the American polling folklore, surveys in the days after President Kennedy’s assassination in 1963 found that a large majority of Americans ‘remembered’ voting for him three years earlier, when he actually defeated Richard Nixon by the narrowest of margins.
That is admittedly an extreme example of false memory syndrome. More relevant is Britain’s experience. It has been quite common down the years for some people who vote Liberal Democrat at a general election to recall later that they backed other parties – normally Labour, probably because they were Labour supporters who ‘lent’ their votes to the Lib Dems at a particular election for tactical reasons.
This means that one must take care when relying on recalled past vote. Different companies deal with this situation in different ways. YouGov collects large amounts of data from its panel at the time of each election, and as far as possible uses this information, rather than remembered vote from months or even years later.
Like YouGov, Ipsos MORI is also wary of recalled voting behaviour. Its solution is not to weight by past vote at all. Instead it relies on detailed demographic, social and geographical quotas. (It is excluded from the table above because it has so far conducted only two polls since February. These put the Yes vote at 36% (February) and 40% (June).)
Recall and reality: 2010
That’s the methodological backdrop. Now to Survation’s data. In its latest poll it asked people not only how they voted in the 2011 elections to the Scottish parliament, but also in the 2010 elections to the House of Commons. Here are its figures (according to the original 33-page version of its tables), compared with what actually happened.
| 2010 general election | Survation recalled vote | Actual result |
|---|---|---|
% | % | |
Labour | 33 | 42 |
SNP | 36 | 20 |
Lib Dem | 11 | 19 |
Conservative | 17 | 17 |
Other | 3 | 3 |
Survation’s figures are plainly way off the mark. The SNP’s share is almost twice as high as the vote it obtained four years ago. Alex Salmond’s party was trounced in 2010 – but, according to Survation, more people remember voting for it than voting for Labour.
Had YouGov produced such figures, I would be extremely concerned. What had we uncovered: a wonky sample, an unusually virulent strain of false memory syndrome, or both? Could it be that shedloads of Labour and Lib Dem voters ‘remember’ voting SNP? Perhaps many people who voted SNP in the Holyrood elections a year later (when the party won 45%) have forgotten that they backed a different party a year earlier. Thus – maybe – entirely accurate memories of behaviour three years ago can be reconciled with widespread amnesia of what people did four years ago.
To test this, YouGov’s latest poll repeated Survation’s question and asked people afresh how they voted in 2010. We also found that too many people recalled voting SNP. But our figure is only 25%. We overstated the party’s share by five points, not 16. Our figures for the other three parties were: Labour 41%, Conservative 17%, Lib Dem 14%. In the light of the SNP’s subsequent victory, and the Lib Dems’ fall in popularity, the modest differences in our survey between recall and reality are not surprising. There does seem to be something odd about Survation’s sample.
Recall and reality: 2014
That impression is reinforced by the next piece of evidence. Survation also asked people how they voted in the recent election to the European Parliament. If we assume that false memory syndrome gets worse over time, then people should have a far more accurate recollection of what they did three weeks earlier than how they behaved four years ago.
This is how Survation’s figures compare with the result.
| 2014 European Parliament election | Survation recalled vote | Actual result |
|---|---|---|
% | % | |
SNP | 39 | 29 |
Labour | 23 | 26 |
Conservative | 11 | 17 |
UKIP | 11 | 11 |
Green | 8 | 8 |
Lib Dem | 6 | 7 |
Others | 2 | 2 |
Once again, Survation’s figures are wide of the mark. They tell of a landslide SNP victory over Labour, not the narrow win it actually secured.
Part of the error may flow from the fact that only one in three Scottish electors actually voted in the European election. After low turnout elections, it’s common for more people to claim to have voted that actually did so. Overclaiming may not be evenly spread; so a poll whose sample is perfect may nevertheless produce ‘wrong’ recall figures. However, this cannot plausibly explain the ten-point gulf between the SNP’s actual vote and Survation’s recall figure.
Once again, YouGov repeated Survation’s question. We found that 29% recalled voting SNP, the same as the election result. For the record, our other recall figures were: Labour 29%, UKIP 15%, Conservative 9%, Green 9%, Lib Dem 6%. There appears to be some overclaiming by Labour and UKIP supporters, and also some Conservatives who ‘remember’ voting UKIP, which gained a lot of publicity for winning its first Euro MP in Scotland.
Overall, 61% of those who voted in the Euro elections backed one of the main ‘unionist’ parties (Lab, Con, UKIP, Lib Dem), while 37% supported one of the ‘independence’ parties (SNP and Green). YouGov’s recall figures are close to those: 60% - 38%. In contrast, Survation’s recall figures are 51% - 47%. That difference between YouGov and Survation matches almost exactly the difference between us on how Scots divide between Yes and No.
This brings us back to our central conundrum. Whether we compare it with the actual election results or YouGov’s recall figures, Survation’s sample contains the right proportion of people who recall voting SNP in 2011 – but far too many who say they voted SNP in 2010 and 2014. What is going on?
Passionate Nats and passing Nats
I believe the clue lies in the nature of the SNP’s victory 2011. It secured a great many votes from people who did not normally support the party. Only around half its support came from passionate Nats, who vote SNP at every election and overwhelmingly want independence. The other half were passing Nats, who wanted Alex Salmond to be First Minister in 2011 but did not vote SNP in 2010 or in May this year. Far fewer of them want independence.
In essence, Survation’s sample contains too many passionate, pro-independence Nats and too few passing Nats.
The biggest single group of passing Nats in 2011 were ‘red Nats’: people who had voted Labour in the general election year earlier. Survation found 246 respondents who voted SNP in 2011. At least 60 of them should have been “red Nats”. In fact the sample contained only 19.
What caused the shortfall? Some ‘red Nats’ in Survation’s sample may have forgotten that they voted SNP in 2011. In YouGov’s latest poll, 10% of those who had previously told us they voted SNP in 2011 now say they voted Labour. We weight our results by what people originally told us – most of them at the time, or soon afterwards. And our weighting system includes a target for ‘red Nats’, so that our published figures contain the right number of them.
Whatever the reason for Survation’s results – the character of its panel, or some ‘red Nats’ forgetting how they voted in 2011, or both – I believe it has ended up with the wrong mix of committed SNP loyalists and occasional SNP supporters. That is why it overstates the number of people who recall supporting the party in the 2010 and 2014 elections – and why it records much higher support for independence than YouGov.
How Survation could have got it right
How much is Survation overstating Yes support? One way to estimate it is to weight Survation’s data not by the results of the 2011 Holyrood election but the far more recent European election. Doing this has the effect of reducing the number of passionate Nats in Survation’s sample to around the right level.
Just over half told Survation they had voted in those elections. When asked how they would vote in September’s referendum, they divided: Yes 245, No 244. Non-voters in the 2011 election, plus the handful who couldn’t remember, divided Yes 118, No 179. Add those together and we get Survation’s overall result: Yes 363 (46%), No 423 (54%). (A further turnout adjustment adds another percentage point to its published estimate of the Yes share.)
Now, if we reweight the figures for those who say they voted in the euro-elections, so that they reflect the actual result, then the voters divide Yes 214, No 290. Add these to Survation’s non-voters, then the overall figures are: Yes 332, No 469. In percentage terms, that’s Yes, 41%, No 59% – close to YouGov’s latest poll and identical to our recent average.
Panelbase, ICM and TNS also adjust their raw figures to match the result of the 2011 election. They seem not to have asked how people voted in 2010 or this year, so it is not possible to make any direct comparison with Survation. However, compared with YouGov, they share Survations’s tendency to have fewer No voters among people who recall voting SNP in 2011. This is consistent with the possibility that they, too, have too many passionate Nats and too few passing Nats.
That could explain why recent surveys from Panelbase and ICM have higher Yes figures than YouGov; but what about TNS? It weights by 2011 vote and also seems to have too many pro-independence SNP loyalists. So how come its overall figures are virtually identical to YouGov’s?
TNS alone conducts its surveys face-to-face. This may have something to do with the fact that far more people than in any other poll say they can’t remember if or how they voted in 2011 (173 out of a total sample of 1,011, according to its weighted figures). And this group supports No against Yes by more than two-to-one. This large pool of No voters offsets the apparent excess number of passionate Nats.
Conclusion
That, then, is the case for regarding with great care any survey that relies on people’s memory of how they voted in 2011. Let me be clear what I am NOT saying. I do not accuse Survation, or any other company, of any intention to bend the truth. On the contrary, I am certain that they try their hardest to publish data that is as accurate as possible. They – and we – know that any systematic bias is likely to result in the embarrassment of inaccurate final polls, published during the week of the referendum.
Survation, in particular, is bound to be striving to improve on its performance in the London elections in 2012 (when it understated Labour’s share by 8 points) and the recent Euro elections (when it overstated UKIP’s share across Britain by 5 points). It also overstated the SNP’s share in the Euro election in Scotland by 8 points in its final pre-election poll, possibly for the same reason that it is overstating SNP support and the Yes vote today. Just as YouGov has done when our figures have been wide of the mark, I am sure Survation wants to learn from its mistakes.
The test for us all will come in September. Meanwhile, what can we conclude about the state of the referendum campaign? This blog has necessarily been longer and more technical than normal. However, my conclusion is simple. A number of recent polls have produced widely-reported stories that the contest is close. They are wrong. It isn’t. The No campaign is well ahead. Its lead has held up for some months. Unless things change markedly in the next eleven weeks, Scotland will vote to remain in the United Kingdom, and by a decisive enough margin to settle the matter for many years to come.
See the full poll results here
Want to receive Peter Kellner's commentaries by email? Subscribe here