Major YouGov poll shows Conservatives set to benefit from collapse in UKIP support, and are projected to gain 90 extra councillors
Over the last week, YouGov surveyed people living up and down the ‘Red Wall’ who are in areas that have local council (district, borough, or unitary authority) elections next week.
Voters across the country will head to the polls on 6 May as part of a ‘Super Thursday’ of local authority, devolved parliamentary, and mayoralty elections being held across Britain. Among the list of councils holding elections are many in the North and Midlands containing constituencies where the Conservatives won seats from Labour at the 2019 general election, such as Bury, Dudley, Wolverhampton, Northumberland, and Durham.
Now, YouGov can reveal that current voting intention figures among those who plan to vote (or have already voted via postal ballot) in the upcoming local authority elections suggest that Keir Starmer’s Labour party could be in for yet another tough night in their former heartlands.
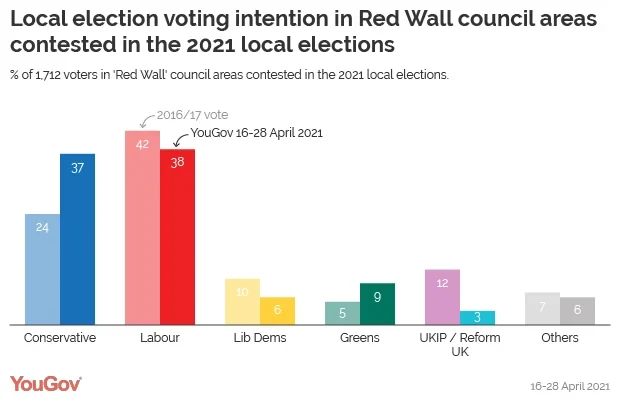
Across the councils included in our analysis, the last time these particular seats were contested the combined headline vote was: Conservatives 24%, Labour 42%, Lib Dems 10%, Greens 5% UKIP 12% and others 7%.
From our fieldwork carried out from 16-28 April, we estimate that the current vote intention for the council elections on 6 May is: Conservatives 37%, Labour 38%, Lib Dems 6%, Greens 9%, Reform UK 3%, and others 6%.

That represents a swing from Labour to the Conservatives of around 9pts.
According to our modelling of the impact of changing voting intention across the Red Wall councils, such a swing could see Labour lose dozens of seats to the Conservatives.
Our forecasting model splits councils firstly into areas that were contested last in 2017 and 2016, and then splits the latter into three geographical groups. The difference between the previous results and our measured voting intention – the swing – was worked out and then applied across each individual group.
The exact figures of seats changing hands are very difficult to measure – many council seats are decided by the slightest of margins, so a small change in overall voting intention could make a big difference to the eventual result.
Our central figures estimate suggests that Labour would lose 59 seats in the 20 areas identified by YouGov as Red Wall councils. Overall, our model suggests Labour losses between a low of 35 and a high of 88 seats.
The Conservatives meanwhile could pick up around 90 extra seats, with an overall range of between 69 and 122 gains.
The Liberal Democrats could lose around a dozen council seats across the Red Wall while the Greens could pick up a couple, but UKIP may well lose all their representatives across the councils. Candidates standing for other parties – including independents – are also projected to be down by around 15.
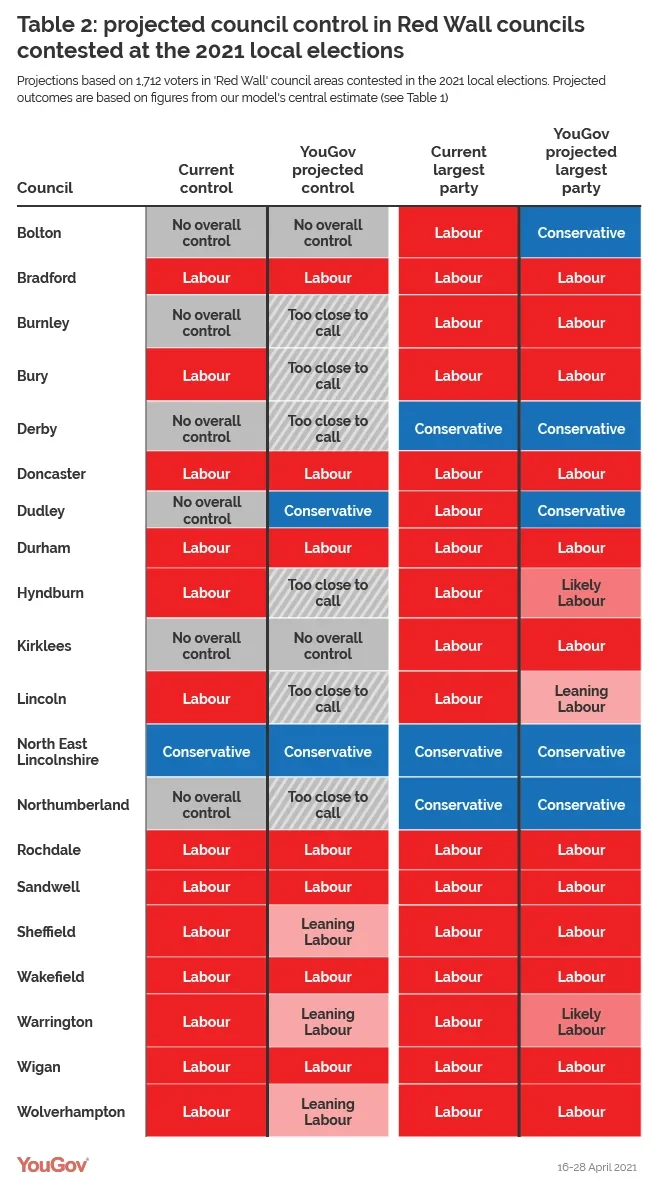
What do these figures mean for council control? Many of our Red Wall Councils are on a knife-edge heading into the elections, and our poll suggests that even more could now be in the balance.
Based on our central estimate, the Conservatives look set to gain majority control in Dudley. In Northumberland and Derby, the Conservatives may well win just enough seats to take full control of the councils there too. Johnson’s party also look set to become the largest party on Bolton council.
Labour may well lose majority control of Bury, Hyndburn and Lincoln councils, but these are all extremely close according to our data and Starmer’s party may well just hang on. On a brighter note for Labour, they look as if they may pick up a number of seats from independent groups and candidates to maintain majority control in County Durham, and could well secure a majority in Burnley (but again, this is looking extremely tight).
Elsewhere, Labour majorities in Sheffield, Warrington and Wolverhampton are also under threat.

Red Wall council voters: how do they differ from the wider public?
What do people in these council areas think of the respective parties and their leadership? And how does this compare to our figures from nationally politically representative samples?
On ‘who would make the best Prime Minister’, 38% of people in Red Wall councils say Boris Johnson, while 30% said Keir Starmer. A further 31% are not sure.
These figures are similar to those from all British adults, with 34% of Brits saying Boris Johnson and 26% saying Keir Starmer on 14 April.
Figures are also similar in terms of the two leaders’ favourability ratings. In a survey this week, Boris Johnson scores a net favourability rating of -11, while Starmer was at -19 among all British adults. In our Red Wall council poll, we found a net favourability rating of -2 for Johnson and -11 for Starmer. While both men are generally viewed more favourably in the Red Wall councils than in the country overall, Johnson is slightly more popular in both instances.
Views are also very similar on the government’s Brexit record. On 26 April, 41% of GB adults suggested that the government had handled the UK’s exit from the EU “well”, while 48% said “badly”. In the Red Wall council areas, 42% think the government has done “well” while 46% think “badly”.
People in Red Wall councils do, however, differ to the population as a whole in their views about whether or not the UK took the right decision to leave the EU. Among the general public, according our poll on 14 April, 41% of people think the UK was “right to leave”, while 45% of people thought it was the “wrong” decision. In Red Wall Councils, 47% of people think it was the right decision, versus 41% who think it was wrong.


