New YouGov research highlights the three distinct groups of undecided voters: those on the cusp of deciding, those who won't vote and those who genuinely don't know who they'll vote for
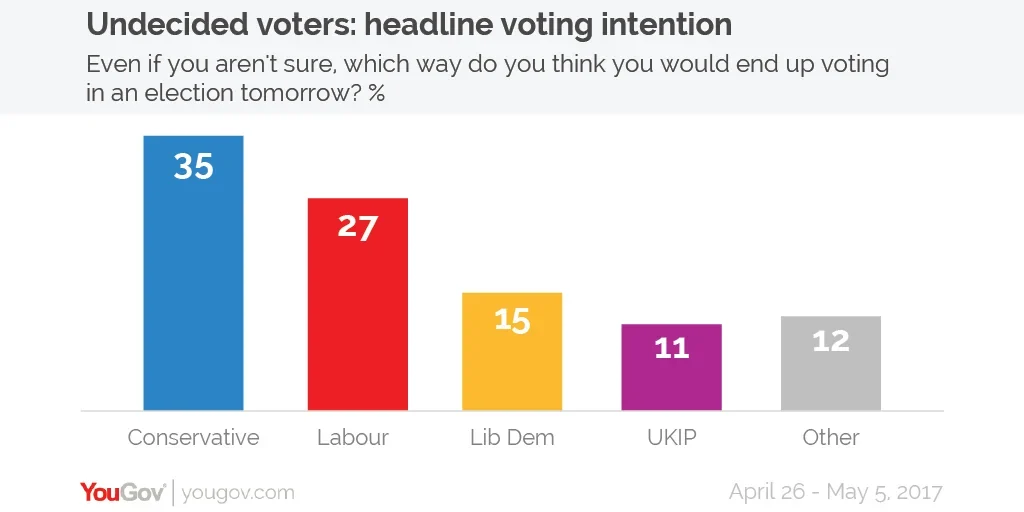
At some point in every general election campaign, the focus moves on to undecided voters. This is likely to be even more prevalent in a snap-election when voters haven’t been given the normal five year cycle to make their decision. Currently, a notable proportion (15%) of the electorate say they are unsure which party they favour, telling us they “don’t know” how they’d vote in a general election – the third most popular choice behind the Conservatives and Labour. This group does not include people who say they won’t vote.
Who they are
Undecided voters look much like the rest of the population, with a similar breakdown of age, social grade, education level, work status, household income or region to all British adults. It is not a shock to see that as a group they are relatively less politically engaged, less likely to identify with a party, and marginally less likely to have voted in the last general election or the EU referendum than the public as a whole.
There are two areas where they stick out, though. One is their gender – while the overall population splits 52% female to 48% male, undecided voters split 64% female to 36% male. The other is that in 2015 they are more likely to have voted Labour and less likely to have voted Conservative.
Broadly speaking, undecided voters fall into three different groups:
- Those on the verge of deciding: They are pretty sure how they’ll vote but haven’t completely made their minds up
- Those who don’t know but probably won’t end up voting: They are likely to not vote in the end
- Those who genuinely can’t decide: They will almost certainly vote but currently don’t know who for
On the verge of deciding (6% of all adults)
If pushed, this group of voters will say which party they are most likely to vote for. Our analysis suggest that four in ten undecided voters currently fall into this category when asked again who they will vote for. We find that 3% say they “will not vote”, and the rest still say they “don’t know” who they would choose.
The Conservative party has a lower vote share among those who are on the verge of deciding than it does among those who have already made up their minds, while Labour’s share is about the same across both groups. The Liberal Democrats, whose vote share has held firm over the last few weeks, potentially have something to gain, with 15% of those close to making a choice saying they will most likely vote this way (though naturally this is a fairly small target group).
Those who don’t know but probably won’t end up voting (5% of all adults)
The second group are those who currently say they don’t know but probably won’t end up voting. Many see voting as a socially desirable act, and so it is possible that people who don’t intend to vote may choose to answer “don’t know” instead of the harder “will not vote” option.
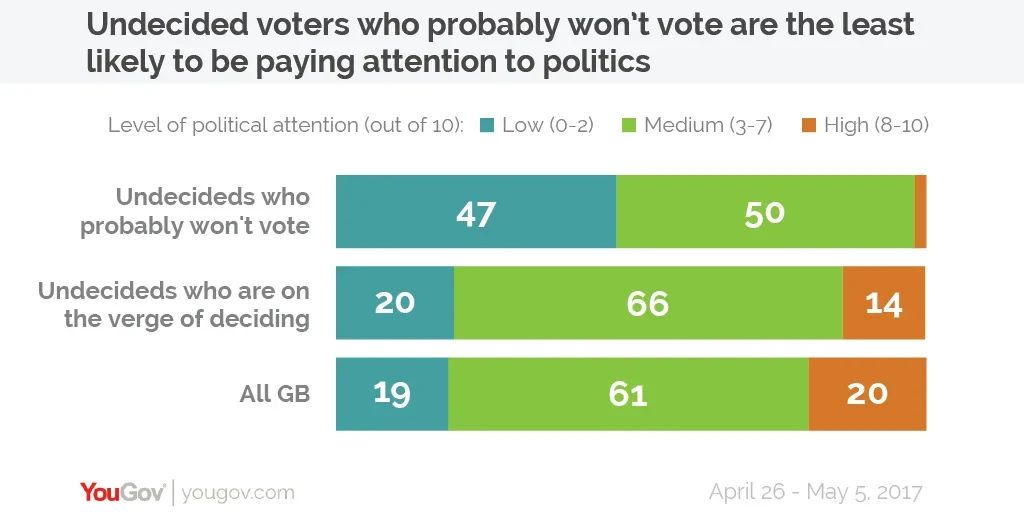
A subtler way of testing whether someone will vote is to ask the question on a 0-10 scale. One way to work out which undecided voters are likely to end up not voting is to assume that those are less than 7/10 certain to vote and who, when pushed on how they will vote don’t pick a party, probably won’t end up casting a ballot.
This group are far less likely to be politically engaged than both decided voters, but also the other groups of undecided voters. Additionally, only 30% of the group say they identify with a political party while 70% do not. When it comes to British adults in general, these numbers are reversed.
Those who genuinely can’t decide (4% of all adults)
After sorting out people into these first two groups, we are left with those who genuinely can’t decide. While they say they are highly likely to vote (being 8+/10 in our likelihood to vote question), they currently don’t know who they will vote for come election day. While they represent only a relatively small proportion of the overall population (just 4%), this is a key group that analysts will be focussing on as we approach the election.
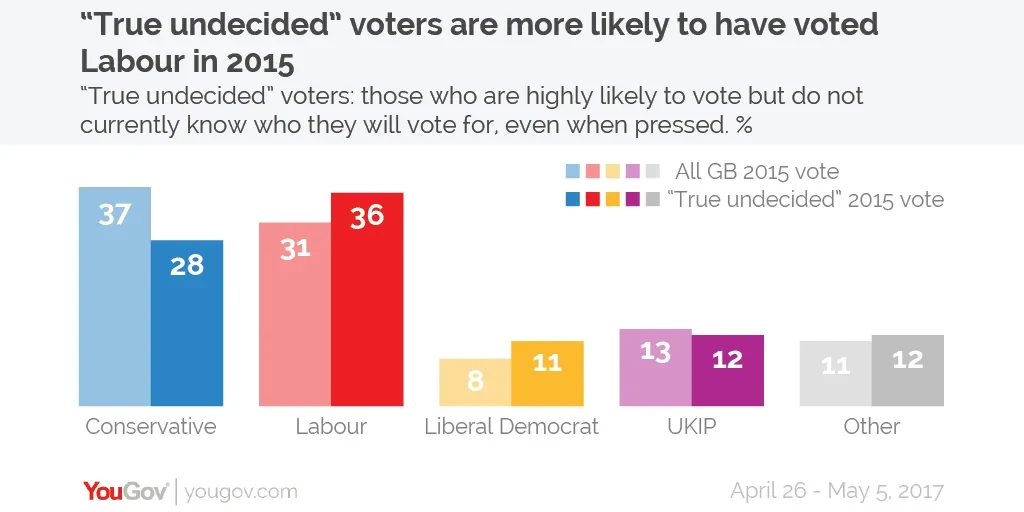
Just like the larger undecided group, they are very similar to decided voters for almost all demographics with the exception of gender. Their EU preference is similar to the rest of Britain, but, crucially, their 2015 past vote is noticeably different as they are more likely to vote Labour than Conservative.
Just over a third (36%) of this group voted Labour in 2015 compared to just 28% who voted Conservative. Labour will be hoping that a combination of policy and muscle memory will tempt back these previous voters on June 8th, but it will face stiff competition from the other parties who will be doing all they can to make them switch.
Although genuine undecided voters represent only a relatively small part of the population, it doesn’t mean they aren’t important. Far from it. Behind the scenes the parties will be increasingly focussing on them as polling day approaches as, despite being a small group nationally, in certain key marginals they could be the difference between victory and defeat.
Photo: PA