
We use YouGov Profiles to compare the two groups
Last week YouGov looked at the kind of people who donated to charity in the last three months. This week we’re comparing people who are and are not likely to donate in the next three months.
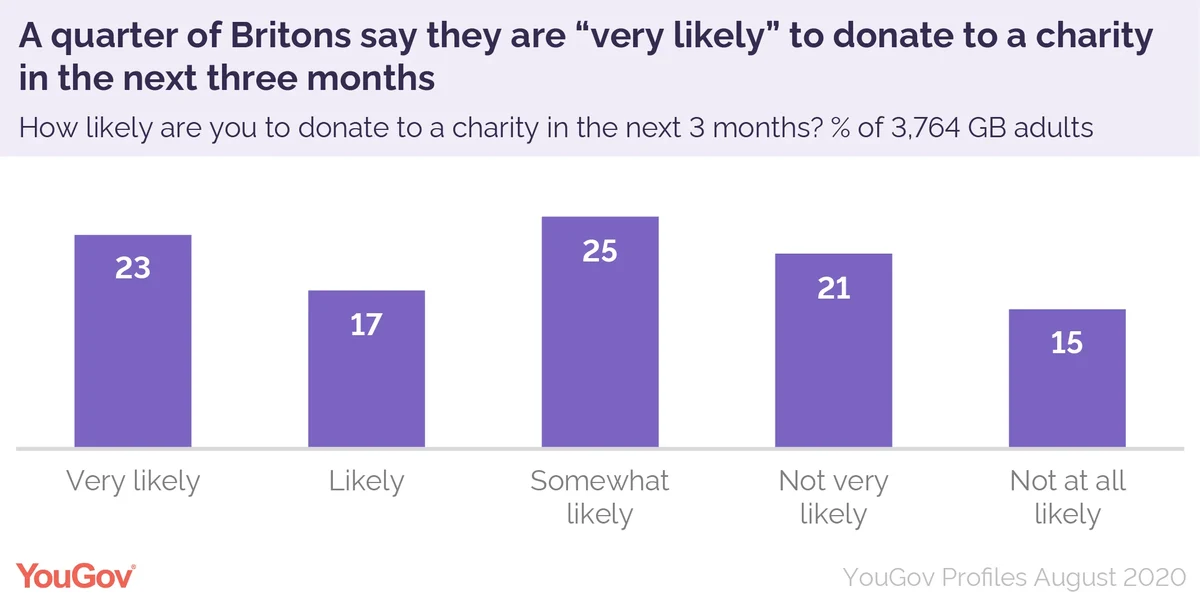
When asked how likely they are to make a donation to charity in the next 3 months, 23% of Britons said “very likely”, while 36% proclaimed themselves either “not very likely” or “not at all likely”.
We’ve used YouGov Profiles to compare these two groups.
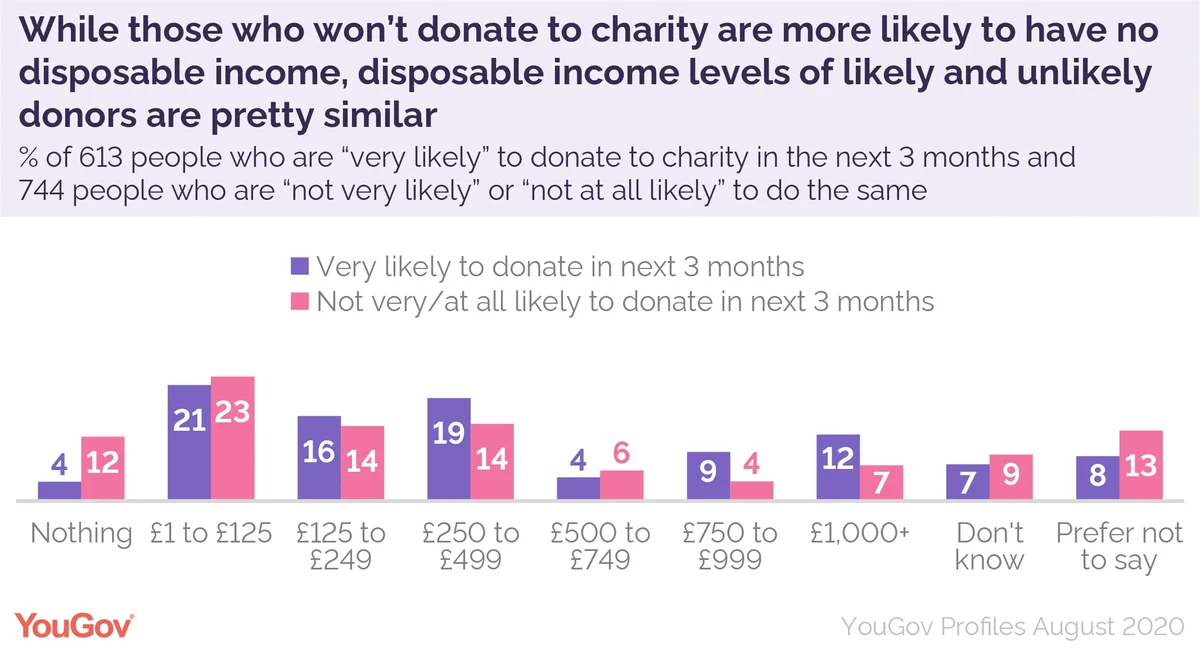
While you might expect disposable income to make a big difference in people’s willingness to donate, the data does not bear that out.
While it is true that unlikely donors are slightly more likely to have no disposable income to donate (12% vs 4% of likely donors), and similarly that likely donors have lots of cash on hand (21% have £750 or more compared to 11% of unlikely donors), the disposable income distribution across both groups is fairly similar. Most people in each group have £1-749 to spare a month, and there is little variance in the sub-categories that make up that figure (see chart).
So if income doesn’t appear to key a key distinction between people’s willingness to donate, what does?
Religion is one such factor: 61% of those who say they are very likely to vote say they belong to a religion. By contrast, 67% of those who say they are very unlikely to vote say they belong to no religion.
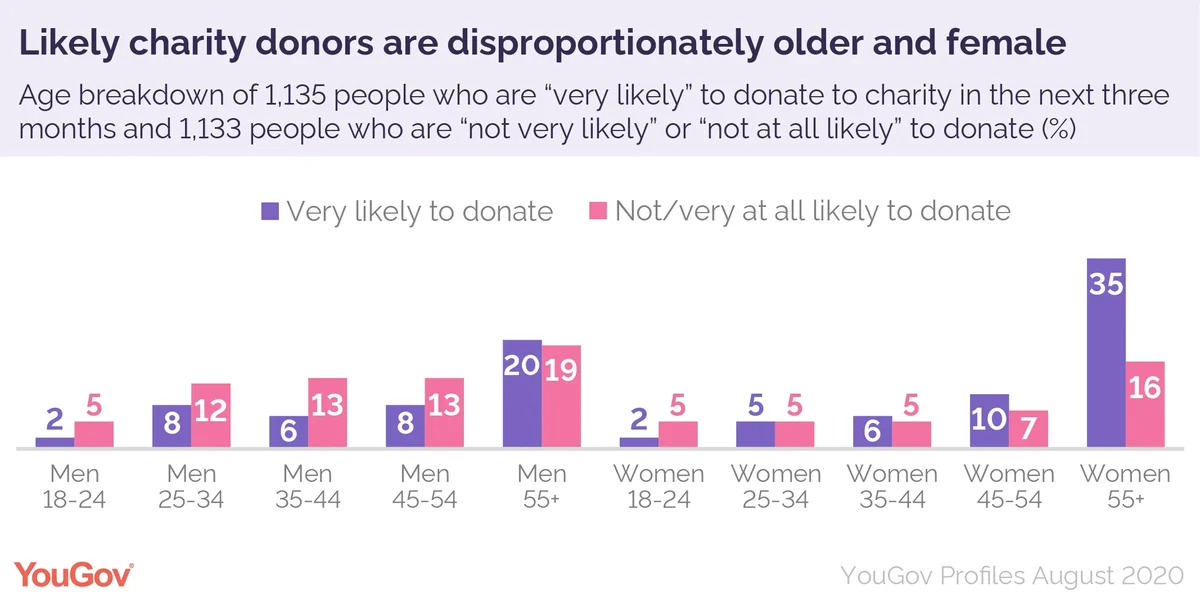
Age and gender are another key factor. Those very likely to donate in the near future are much more likely to be older women: 35% of this whole group is composed of women aged 55 and above. By contrast, only 16% of those who probably won’t donate are women of this age.
Non-donors, therefore, are more likely to be men under the age of 55, with 43% of this group falling into this demographic category compared to only 23% of likely donors.
Given their older age profile it is not surprising to see that very likely donors are more likely to be retired. One in three (36%) have hung up their work boots, compared to only 20% of those who are very unlikely to make a donation soon.
Likely donors are more likely to hold a degree – 34% to 22% among unlikely donors. By contrast, unlikely donors are more likely to have a low level of education – qualified to no higher than GCSE level – by 36% to 24%. Similar proportions of each group are educated to a ‘medium’ level, i.e. A level or similar.
Likely donors are also notably more likely to speak a second language than those who are not, by 42% to 30%.
Motivations for giving
While they may not be willing or able to make a donation in the next three months, the majority (56%) of unlikely donors have given money to charity in the past.
If we exclude those unlikely donors who have never donated we can compare more clearly what has compelled people in the two groups to donate previously.
The top answer for both groups is simply “I believe in the cause” – 83% of likely donors answered this way, as did 55% of unlikely donors.
Likely donors seem to have more of a moral compunction to part with their money, with 42% saying “I believe you should give to charity” compared to only 8% of unlikely donors. This is the biggest difference between the two groups.
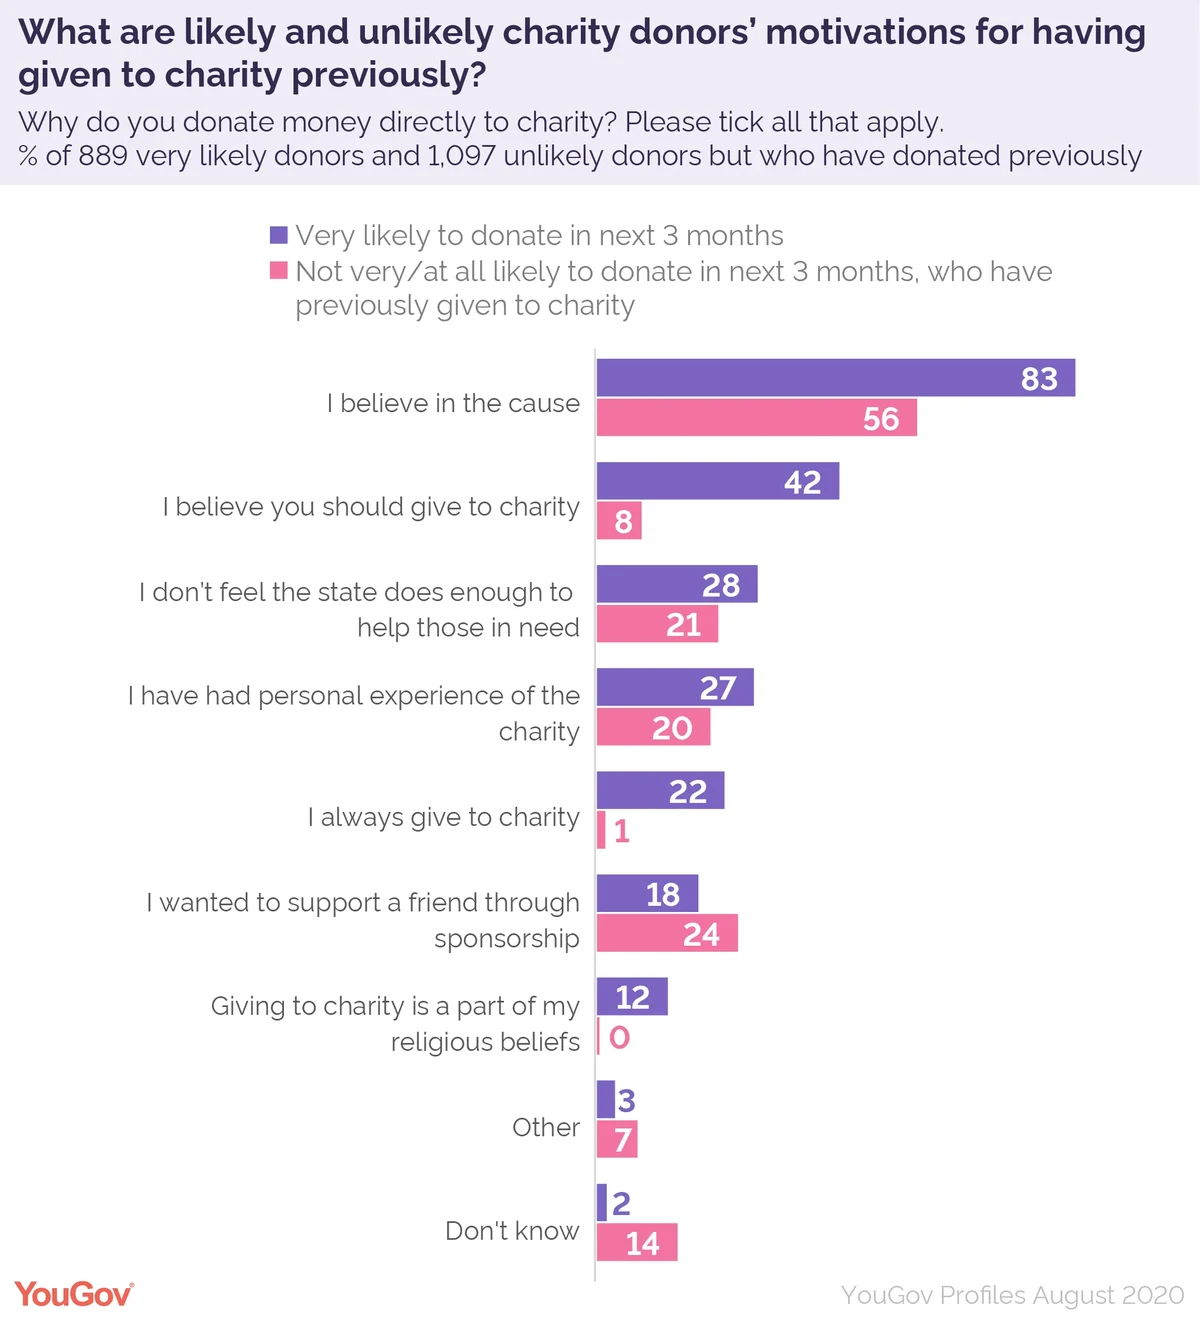
One in five likely donors cite habit: 22% say “I always give to charity” compared to just 1% of unlikely donors.
As noted above, religion is a key difference between the two groups. One in eight likely donors (12%) cite their religion directly in their motivations for donations, compared to a statistical 0% of unlikely donors.
There was only one motivation that unlikely donors were more likely to give than likely donors: friendship. A quarter (24%) of unlikely donors said they had given previously by sponsoring a friend they wanted to support, slightly higher than the 18% of likely donors who have done so.