This report looks at the experiences of motor insurance policyholders when purchasing a policy and making a claim. The report essentially considers the policyholder customer journey from the time he/she recognises a need to make a purchase to the point that the policyholder becomes a customer and may need to make a claim. It looks at how this journey is accomplished and how problems and claiming can influence the purchase decision.
The report also takes a detailed look at the claims process and the incidence of claiming for different events, for example accidents and personal injury.
Over 60 questions were asked in total, covering the following topics:
- The type of motor insurance policy owned
- How policyholders pay for their insurance, why they choose a specific method, and how much they pay
- With which company are policyholders insured
- How well do policyholders understand the policies they own
- Policyholder attitudes to insurance
- When policyholders last switched provider and what prompted the switch
- Why non-switchers decided to stay with an incumbent provider
- Where and how do policyholders look to find new insurance deals – and how active are policyholders in looking for those deals
- The use of and attitudes towards price comparison websites
- How policyholders apply for a new policy
- Have policyholders been refused cover – and if so why
- What factors determine the policy purchased
- Are policyholders considering switching provider in the future and if so, why
- What impact do rising premiums have on future switching
- Why do policyholders think premiums have risen and how does this impacts on policyholder attitudes to their provider
- The incidence of claiming for an accident
- Policyholder actions that might invalidate a claim
- The incidence of claiming for personal injury and why policyholders made a claim
- How claims are processed and the policyholders attitudes to the process
- How successful claims are and why they may have wholly or partially failed
- Have policyholders complained about their insurer and the impact on policyholder loyalty
- The claims lifecycle (how long a policyholder was with an insurer before making a claim)
- Ownership and attitudes to legal expense insurance
Methodology
For this report, YouGov SixthSense surveyed 2,118 motor insurance policyholders aged 17+ via YouGov’s online panel.
Three forms of statistical analysis are used in this report:
Correspondence analysis
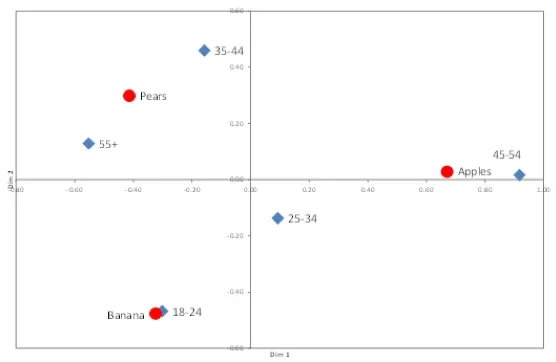
Correspondence analysis (CA) is a multivariate statistical technique which provides a means of displaying or summarising a set of data in two-dimensional graphical form. The technique takes data in a contingency table like below:
| Fruit preferences | |||
|---|---|---|---|
Apples | Pears | Bananas | |
18-24 | 20% | 30% | 50% |
25-34 | 40% | 30% | 30% |
35-44 | 30% | 60% | 10% |
45-54 | 80% | 10% | 10% |
55+ | 10% | 60% | 30% |
It then calculates a statistic for each cell in the table. From that it produces two (or more if wanted) dimensions (factors or axis).
| Dimension/Axis | 1 | 2 | 3 |
|---|---|---|---|
Contribution of each dimension to fit (%) | 73.2 | 26.8 | 0.0 |
Row and Column Coordinates | |||
Row or Column | Dim 1 | Dim 2 | |
18-24 | -0.30 | -0.47 | |
25-34 | 0.09 | -0.14 | |
35-44 | -0.16 | 0.46 | |
45-54 | 0.92 | 0.02 | |
55+ | -0.55 | 0.13 | |
Apples | 0.67 | 0.03 | |
Pears | -0.41 | 0.30 | |
Banana | -0.32 | -0.48 | |
By plotting the axes data, the correspondence graphic is produced (see below). On the graphic, the closer the items are on the graphic to each other, the more they correspond to one another (e.g. see bananas and 18-24). The axes do not have to have any specific meaning, but sometimes they can clearly be related to some of the data in the analysis (e.g. rising age from left to right or up and down).
Cluster analysis
Cluster analysis is a method for grouping consumers of a similar kind into respective categories. The technique sorts consumers into groups in a way that the degree of association between two consumers is maximised if they belong to the same group and minimised otherwise.
Factor analysis
Factor analysis reduces the number of variables in an analysis and provides information to assess the structure in the relationships between variables. For example, if consumers have indicated agreement with a list of 15 statements, factor analysis may be able to reduce this to five factors, which are related in some way.