YouGov conducts one of Britain's biggest ever post-election surveys to chart how the nation's political character is shifting
Since last week’s election result YouGov has interview over 50,000 British adults to gather more information on how Britain voted. This is part of one of the biggest surveys ever undertaken into British voting behaviour, and is the largest yet that asks people how they actually cast their ballots in the 2017 election.
The bigger sample size allows us to break the results down to a much more granular level and see how different groups and demographics voted on Thursday.
Age
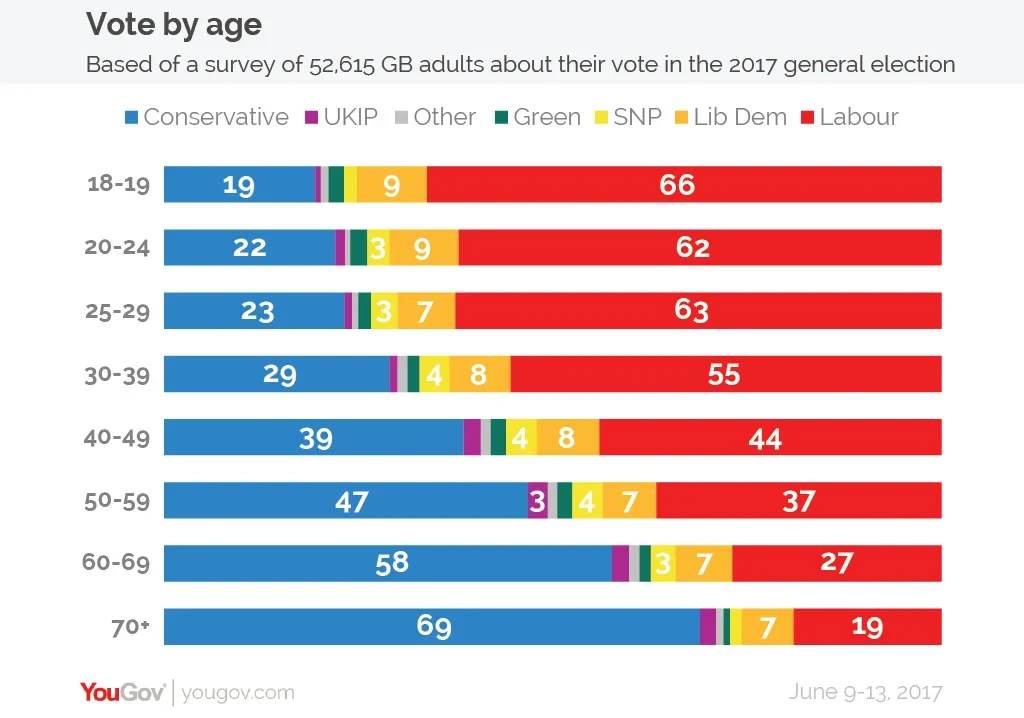
In electoral terms, age seems to be the new dividing line in British politics. The starkest way to show this is to note that, amongst first time voters (those aged 18 and 19), Labour was forty seven percentage points ahead. Amongst those aged over 70, the Conservatives had a lead of fifty percentage points.
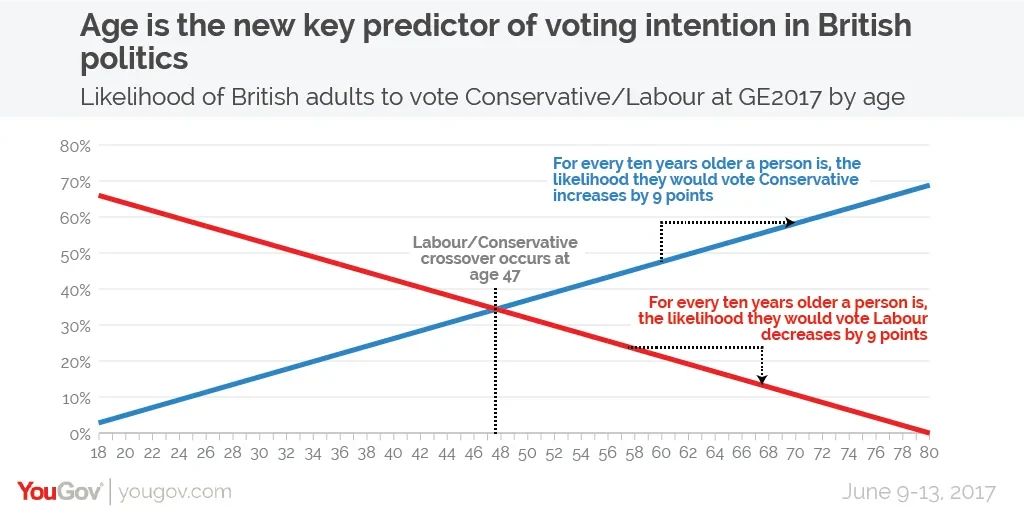
In fact, for every 10 years older a voter is, their chance of voting Tory increases by around nine points and the chance of them voting Labour decreases by nine points. The tipping point, that is the age at which a voter is more likely to have voted Conservative than Labour, is now 47 – up from 34 at the start of the campaign.
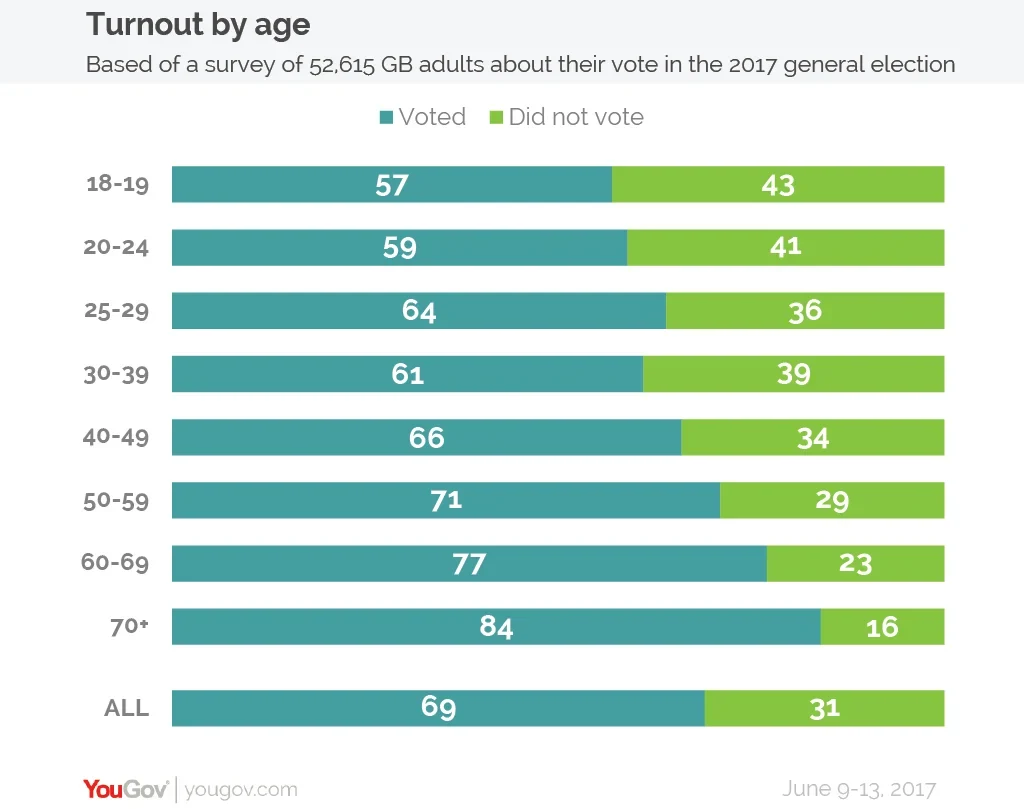
Despite an increase in in youth turnout, young people are still noticeably less likely to vote than older people. While 57% of 18 and 19 year-olds voted last week, for those aged 70+ the figure was 84%.
Class
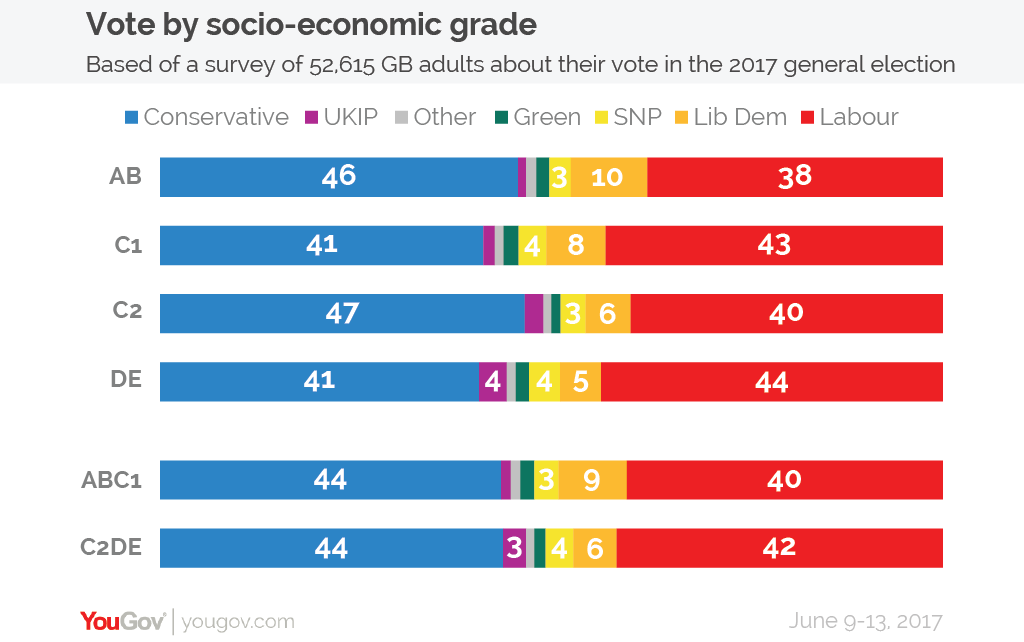
As noted at the start of the campaign, the class divide in British politics seems to have closed and it is no longer a very good indicator of voting intention. Despite dramatic voter movements towards Labour over the past few weeks this theme has held reasonably consistent: Labour is now 4% behind amongst ABC1 voters and 2% behind amongst C2DE voters.
The picture is a bit more mixed if we split this out further, with Labour doing best amongst DE voters (semi-skilled and unskilled manual occupations, unemployed people and those in the lowest grade occupations) and the Tories doing best amongst C2 voters (skilled manual occupations).
Education
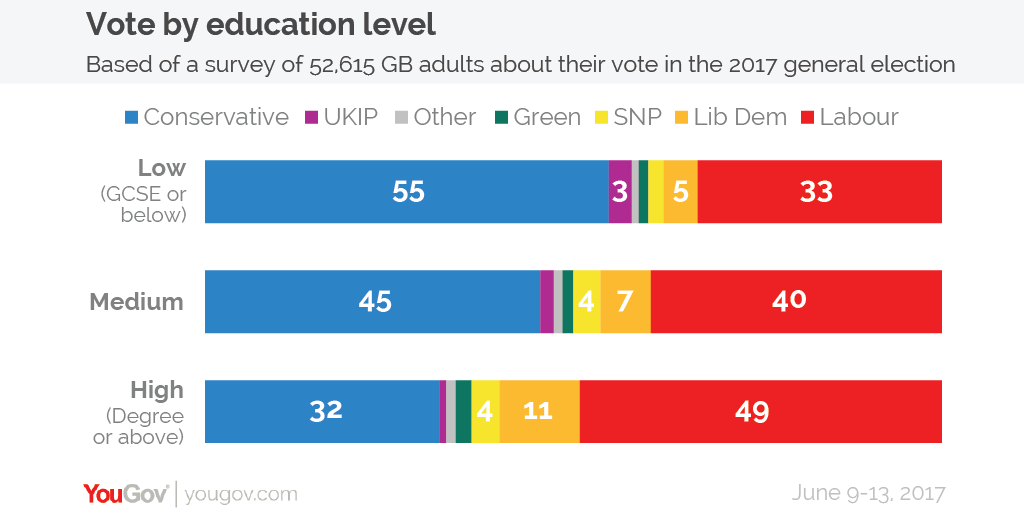
Alongside age, education has become one of the key electoral demographic dividing lines. We saw it was a huge factor in the EU referendum campaign and, after the last general election, we made sure we accounted for educational qualifications in our methodology. In last week’s vote, while the Conservatives’ support decreases the more educated a voter is, the opposite was true for Labour and the Lib Dems.
Amongst those with low educational qualifications (defined as GCSE or equivalent or below) the Conservatives beat Labour by 22%. However amongst those with high level educational qualifications (defined as degree-level or above) Labour led by 17 percentage points. Part of this relationship is down to age – the expansion of education means that, on average, the young have more qualifications than the old, although the Conservatives still have a “graduate problem” even after accounting for this.
Gender
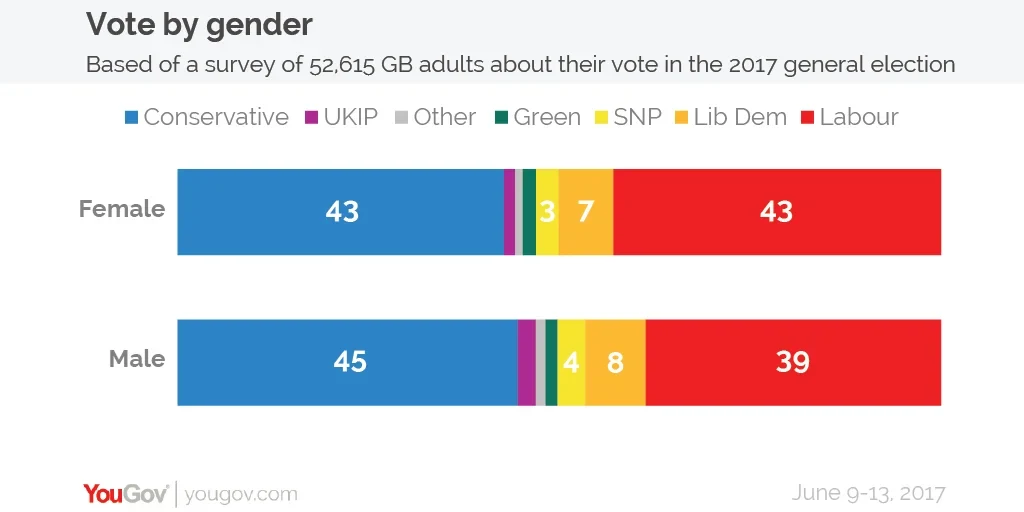
There was only a small gender gap between men and women, with women being equally split between Labour and the Conservatives (43% to 43%), and men slightly more likely to have backed the Tories (45% to 39%).
Employment status
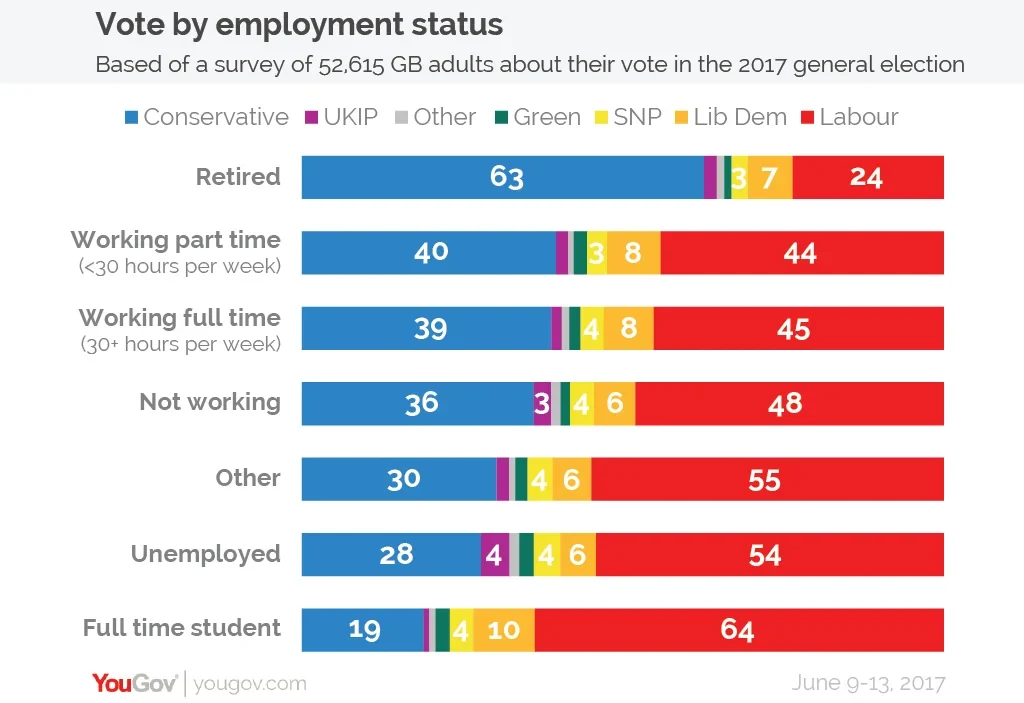
Given the importance of age and voting it is not surprising that there is also a link between people’s employment status and who they cast their ballot for. The Conservatives are 39 points ahead amongst retirees and Labour are 45 points ahead amongst full-time students.
Labour is in fact ahead amongst those in work: 4 points ahead amongst those working part time and 6 points ahead amongst those working full time, illustrating how the Conservatives are increasingly relying on the grey retired vote.
Newspaper
Beyond standard demographics, our data also shows a wide variation in voting behaviours based on the newspapers people read. The most pro-Conservative newspapers are the broadsheet Telegraph (+67), but also the “blue-top” Express (+62) and Daily Mail (+57).
The most pro-Labour newspapers are the Guardian (+65), the now fully-online Independent (+51), and the Daily Mirror (+49). This is based on the newspaper that respondents say they read “most often”.
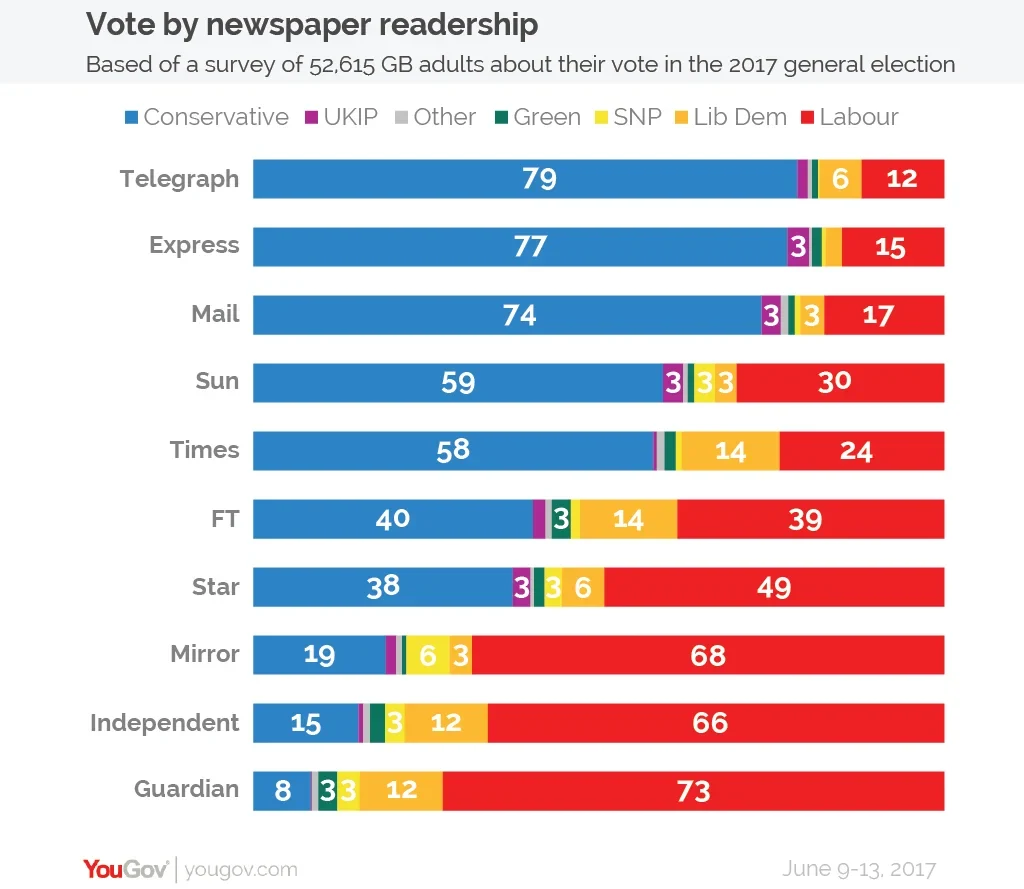
Photo: PA


