Seven in ten Britons support Britain continuing to have a monarchy
With the nation gearing up for the Royal Wedding this weekend, YouGov Profiles reveals the characteristics of those who believe Britain should have a monarchy.
Over two-thirds (69%) of Britons are monarchists. This figure is more than three times higher than the number who oppose (21% don’t want a Royal family), with the remaining 11% saying they don’t know either way.
Demographics
While the majority of people in all age groups support Britain having a monarchy, the older Britons are the higher this level of support gets: 57% of 18-24 year olds are monarchists, a figure which rises to 77% among those aged 55 or older. While men and women overwhelmingly support Britain having a monarchy (67% and 70% respectively), men (25%) are more likely than women (17%) to oppose it.
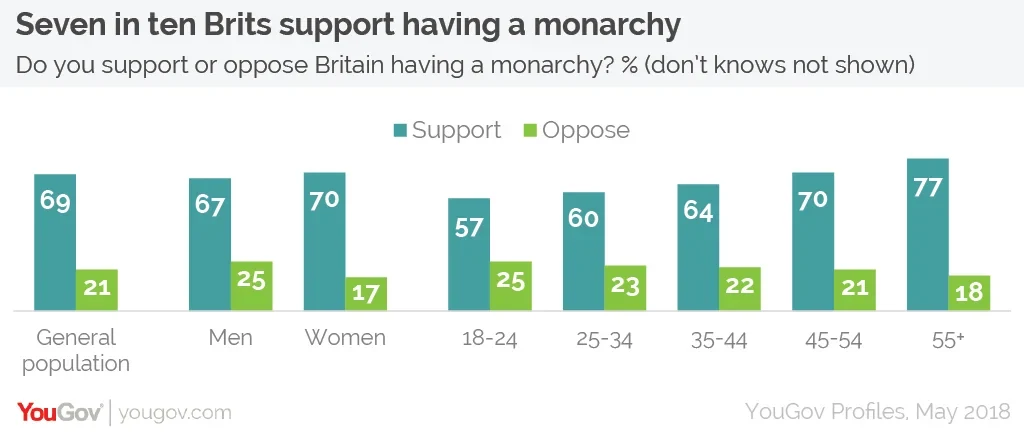
In geographical terms, support for the monarchy is noticeably lower in Scotland than in the rest of Britain. Even here, however, the majority of people (53%) still support Britain having a monarchy, compared to 36% who oppose.
Politics
Being a Conservative voter is a key factor in whether or not someone supports Britain having a monarchy. In 2017, 49% of monarchists who voted backed the Conservatives (compared to 13% of those who oppose anti-monarchists). By contrast, only 34% of monarchists voted Labour, compared to 61% of people who don’t want a Royal family.
Monarchists are slightly more likely to be Leave voters, with those who cast a ballot in 2016 splitting 56%/44% in favour of Brexit, while those oppose Britain having a Royal family voted 65%/35% in favour of Remain.
Attitudes and issues
Monarchists are much more likely to display a sense of national pride than non-monarchists. Almost eight in ten (79%) describe themselves as either “very” or “quite” patriotic (compared to 41% of non-Royalists). Almost nine in ten monarchists (87%) state they are proud to be British, 81% make an effort to support British businesses and 74% prefer to buy British brands. Among those who don’t want a monarchy these figures are 55%, 61% and 52% respectively.
In terms of issues, the largest differences between those who want a Royal family and those who don’t include monarchists being more likely to support the UK having nuclear weapons (65% to 34%), being more likely to oppose Scottish independence (60% to 36%), and being more likely to support tightening immigration restrictions (81% to 54%).
Which royal do monarchists like the most?
While monarchists obviously hold the royal family in high regard, which royals do they like the most? The results reveal that the Queen is monarchists’ favourite royal, with 92% saying they like her. In second place is Prince Harry on 87%, followed by older brother William on 83% and wife Kate on 82%.
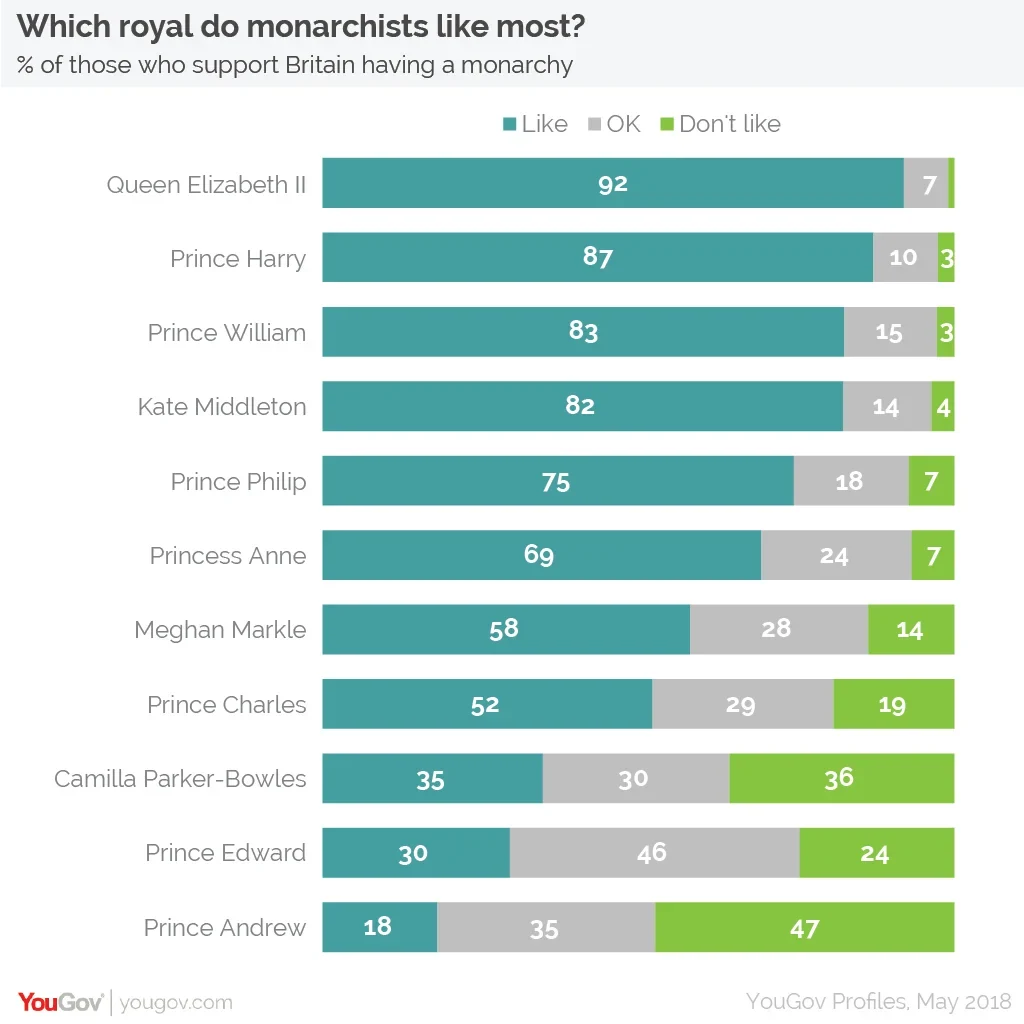
Forthcoming addition to the family Meghan Markle is liked by 58% (but only disliked by 14%), making her more popular than Prince Charles (52%), Camilla Parker-Bowles (35%) and Princes Edward (30%) and Andrew (18%). As well as being the least well-liked, Prince Andrew is also the member of the Royal family that monarchists actively dislike the most (47%).
Photo: Getty