The ‘horse race’ is only one part of predicting the outcome of the EU referendum. Another vitally important dimension is who will turn up to vote on the day.
These two dimensions, voting intention and likelihood of voting, matter to the EU Referendum campaign as they do to any political campaign. The primary role of such campaigns is to win over supporters to your side, but also to convince your supporters – both old and new – to actually turn out to vote.
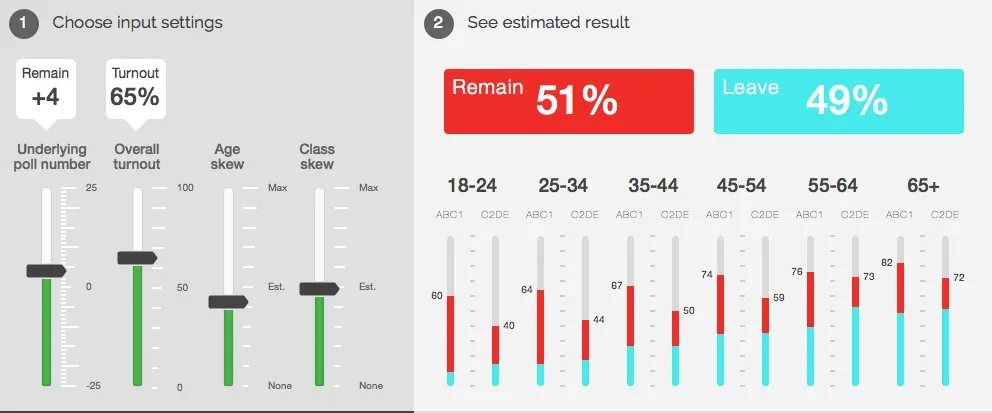
LAUNCH INTERACTIVE FEATURE
YouGov’s data currently shows that, when it comes to the question of European Union membership, those who wish to leave the EU are more likely to say they will vote than those who wish to stay. This means we can conclude, generally speaking at least, that a lower turnout come polling day should favour the Leave campaign.
But being more precise than this quickly becomes difficult. Firstly, polls are only a snapshot of opinion at the present time. They are not intended to be, nor should they be used as, predictions for where we will be further down the line. Things may very well change, and historical precedent suggests they almost certainly will.
Secondly there is the big issue that accurately recording turnout via opinion polling is extraordinarily difficult. All polling methods, whether conducted online, via telephone or face-to-face, almost without exception over-estimate the number of people who will actually vote.
Part of the problem is that we, the general public, are often quite poor at predicting our own behaviour. Asking people whether they intend to vote is an abstract concept that can be understandably difficult to answer correctly, particularly this far out.
One theory used to explain why people vote suggests that they will do so if they feel that the perceived chance of deriving benefits from voting (making a difference) combined with a sense of civic duty (that voting is the ‘right thing to do’) outweigh the perceived costs of voting (the hassle of registering, the time taken to go to the polling booth, the risk of rain etc). This decision making process can be conscious, but it is usually unconscious.
Either way it is difficult to predict when the vote itself is still weeks away. In the context of polling, these costs are much lower than in real life, of course – the ‘cost’ of saying you are going to vote in a poll is clearly less than actually doing so.
Added to all of this is the debate over question wording. While question wording for the EU referendum voting intention question itself is broadly the same across both surveys and pollsters, the question (or questions) used to identify if someone will vote can vary hugely. Some ask a 0 to 10 scale, others deliberately have the question loaded towards not voting. Some use just one question, others a series. Some talk just about voting, others look at things like civic duty in more broad terms.
Ultimately there is no ‘right’ or ‘wrong’ way of doing it and no method is perfect. Instead most pollsters develop an estimate that they feel works best, usually through a combination of historical data and current trends.
And so we arrive at YouGov’s data for turnout. As mentioned, at the aggregate level there is a difference between supporters of Leave and Remain, but this difference is by no means enormous. When just over 5,000 of the most recent EU Ref survey respondents were asked to say on a scale from 0 to 10 how likely they are to vote in the EU referendum, Leave supporters have a mean score of 9.07 with Remain supporters just behind on 8.93.
While the aggregate scores are close, they do, for the reasons discussed, point to a higher turnout than might be expected come election night. Even so, the data can be used to provide insight on how the two sides of the referendum debate fare as turnout changes.
Plotting the relative levels of support for leave and remain as turnout moves from the minimum (just respondents who gave a score of 10 out of 10) to the maximum level (all respondents) shows the changing fortunes for both sides as turnout increases.
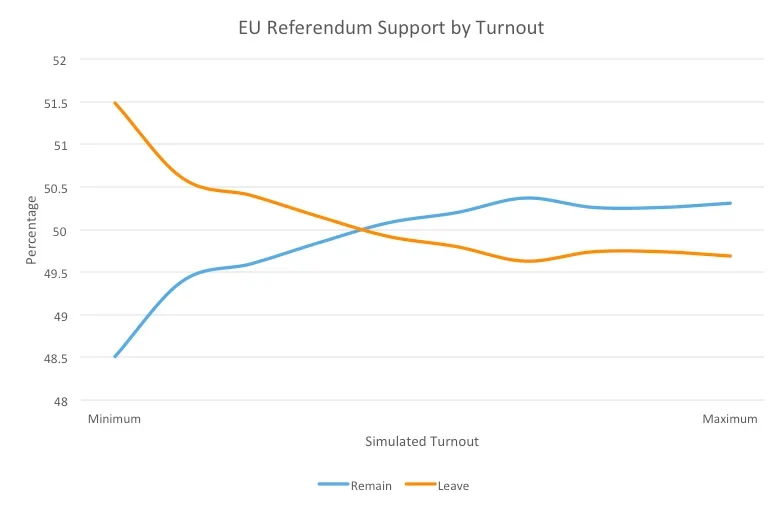
YouGov’s data shows a low turnout may indeed favour the Leave campaign, with the largest lead at the lowest reported turnout. In other words Leave have the greater number of supporters who say they are certain that they will vote. As the number of people saying they will turnout increases that lead for Leave rapidly disappears, with Remain moving ahead. The relationship is not linear, however, and further gains for remain are virtually non-existent at the highest levels of turnout.
Furthermore, different social and demographic groups favour one side or the other to varying degrees, with the electorate divided (sometimes deeply) across many different lines. Very few people will be surprised, for example, that UKIP voters almost exclusively favour leaving, while Labour supporters overwhelmingly opt for remain. At the same time, as we reported at the very start of the race, younger people largely favour the status quo while the proportion of older people who support change is almost as large.
Some of the key demographic groups who favour Brexit are indeed more likely to vote, but this is by no means true for all of them. Of 25 groups that were analysed, UKIP supporters were, for example, the strongest supporters of leaving the EU and were ranked second highest in terms of likelihood to vote. Similarly those aged 60 and above are the group with the second highest levels of support for leave and fourth in terms of likelihood to vote.
The overall picture becomes more muddled, however, with the next three groups. Respondents from C2, D and E social grades, those not educated at university and those with low political interest all rank highly in terms of levels of support for Leave, but are near the bottom of the list when it comes to likelihood to vote.
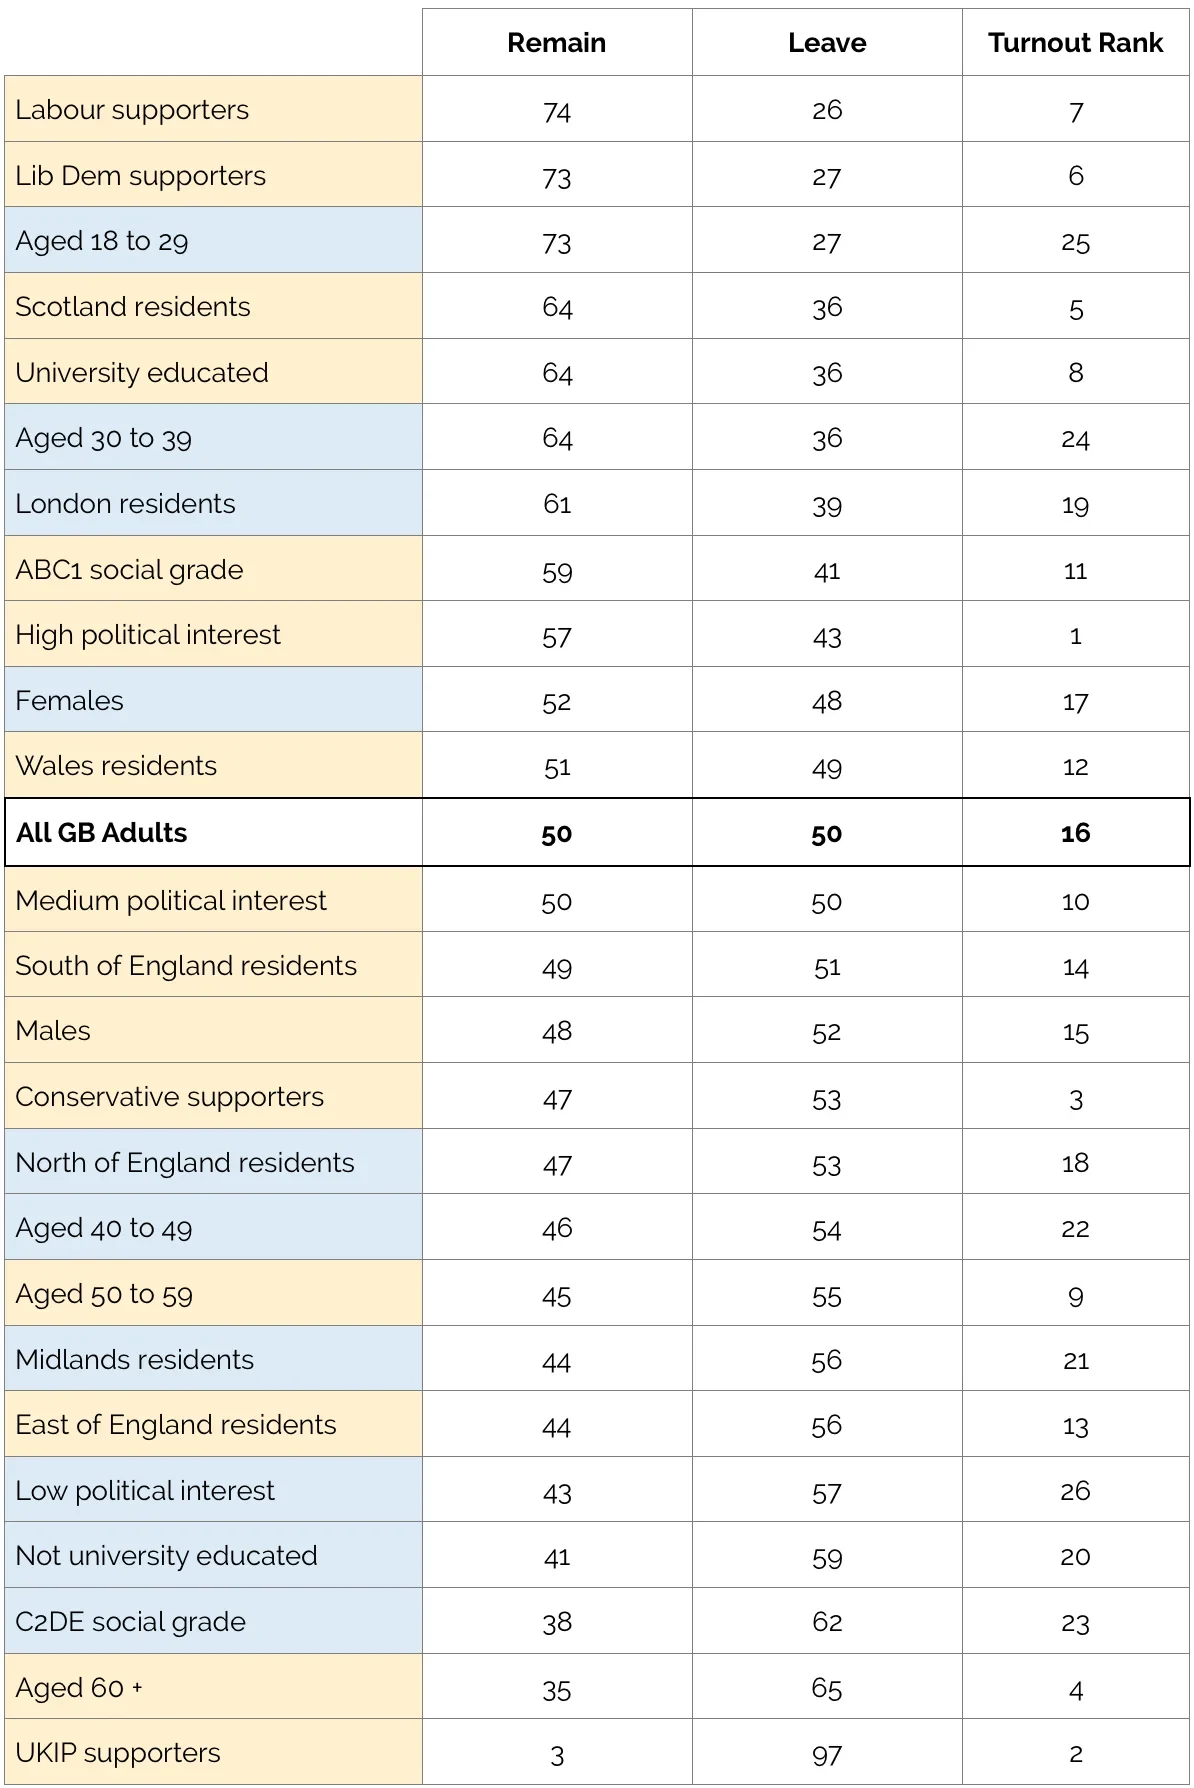
On the other side of the debate the picture is equally complicated. In line with what would be expected, those in their teens, twenties and thirties along with those in London are all among the strongest supporters of Remain, but below the national average in terms of likelihood to vote. At the same the Scots, those who are university educated and people from the A, B and C1 social grades are near the top both of support for Remain and likelihood to vote. It gets messy quite quickly:
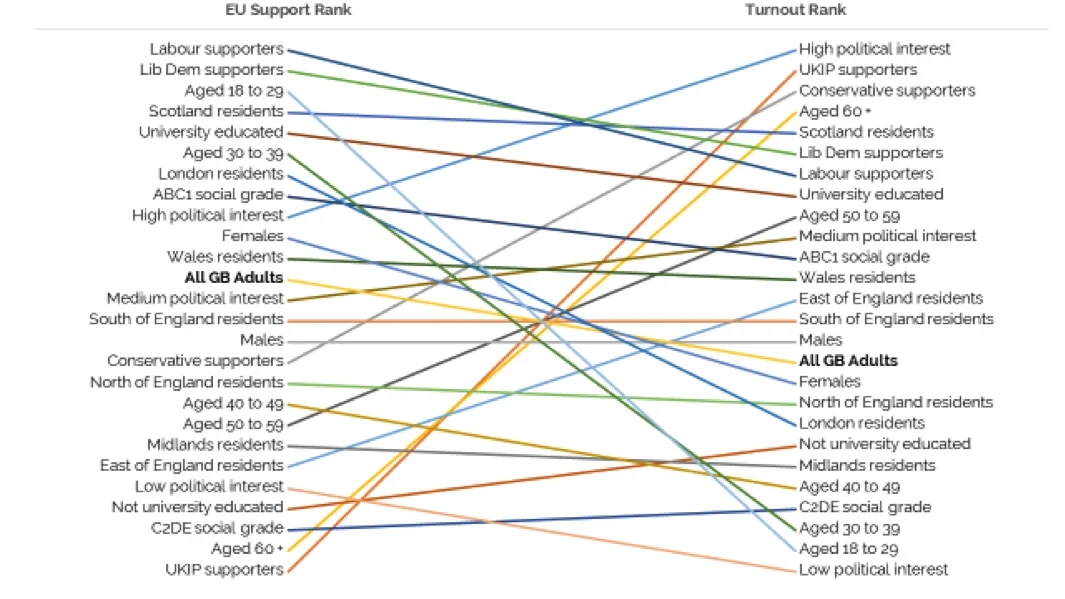
These 25 are clearly not mutually exclusive, but the distinction is important because of the impact that the remainder of the campaign could potentially have on specific groups and the effect that may, in turn, have on the eventual result. An increase in turnout among some, but not others, could substantially boost one side’s chances of victory or it could have little effect – it depends on the groups.
YouGov has shown through its own internal analysis that our online samples are superior at accurately representing the education levels of British adults, and that this is a key social division in terms of support for Brexit. The relationship between different levels of educational qualifications and turnout levels could yet prove equally vital, if turnout among those less educted groups that more strongly favour Brexit is low.
With over a month remaining and both sides of the campaign attempting to appeal to different types of people in different ways, one thing is for sure: turnout will be vitally important and could still make all the difference.