
The following is a guest commentary by Robert Ford (University of Manchester), Laurence Janta-Lipinski (YouGov) and Maria Sobolewska (University of Manchester).
A shorter version of the article can be read here.
Last month, the widely respected British Future think tank published new research looking at the ethnic minority vote choices in the last election. The research, conducted by internet poling company Survation, suggested that the longstanding link between ethnic minorities and the Labour party was fraying, and that the Conservatives might at last be breaking through with minority voters, having achieved a 33% share of the 2015 ethnic minority vote overall, and with a lead over Labour among Hindu voters. The authors concluded that the gap between the two main parties in support from ethnic minorities is "shrinking dramatically". The report triggered plenty of media and political debate, and fits with earlier research suggesting a sharp erosion in ethnic minorities' traditional partisan loyalties to Labour.
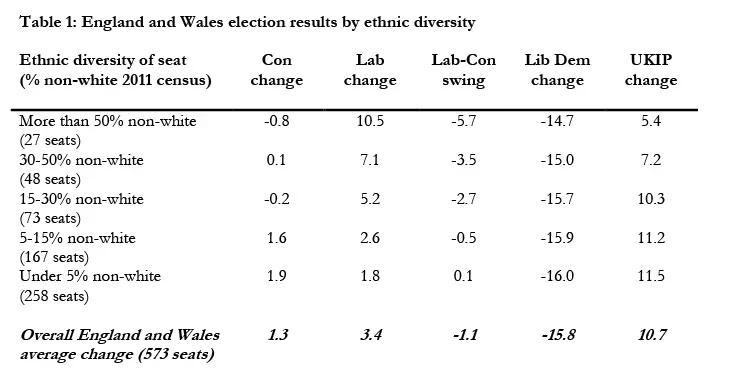
However, the British Future findings are harder to square with the pattern of constituency results in last month's general election. If the Conservatives outperformed, and Labour fell back, among ethnic minority voters we would expect to see a stronger Tory advance, and a Labour decline, in the most ethnically diverse seats in England and Wales (we exclude Scotland due to the dramatic impact of the SNP). In fact, as table 1 illustrates, the opposite is true. In the 27 seats where more than half the resident population was from an ethnic minority group in the 2011 Census, Labour advanced by over 10 points on average, and the Conservatives fell by nearly one point, a nearly six point swing away from the Conservatives. This pattern is repeated in the larger set of 48 seats with a 30-50% ethnic minority electorate, where Labour also out-performed their national figures, and the Conservatives under-performed. The Survation-British Future report suggests a large shift from Labour to the Conservatives in 2015, yet the constituency results show that the more diverse the seat is, the better Labour did. What explains the mismatch?
One important possibility is that the Survation polling data is not fully representative of the ethnic minority electorate. As last month's surprise election result demonstrated, it is hard to poll the general population's vote preferences accurately. Polling the ethnic minority electorate poses additional challenges – ethnic minority voters tend to be younger, many are relatively recent arrivals in Britain, many speak relatively poor English, have low incomes, and low formal education levels, and some move around a great deal. All of these are factors which make individuals harder to reach with surveys, particularly online, and all may also correlate with their political choices. The risk this then creates is that the high Conservative vote share recorded by Survation may not reflect a genuine shift in ethnic minority vote choices, but instead a skewed sample of ethnic minority voters, with too many respondents from the older, better educated, more well off and well established sections of the ethnic minority population. These are all also sections of the electorate who may lean more towards the Conservatives.
There are three things we can do to build on the initial British Future findings, and test the extent to which the Conservatives really are "closing the gap" with minority voters? Firstly, we can compare the 2010 vote choices among web panel survey respondents with the patterns of vote choice found in Britain's most authoritative study of ethnic minority voting behaviour, the 2010 Ethnic Minority British Election Study (EMBES).1 If the ethnic minority web panel sample is representative, there should be little difference between the two.
Secondly, we can then look at the change in the behaviour of ethnic minority voters between 2010 and 2015. If the Conservatives are "closing the gap" with minorities then we should see a swing from Labour to the Conservatives among these voters between 2010 and 2015. However, if the ethnic minority sample is politically skewed, this estimate of change could also be skewed – the same sampling issues which can lead party supporters to be over-represented or under-represented can also lead to an inaccurate sample of the "swing" voters who change their minds between elections. Therefore, our third analysis will reweight the web panel data to try and correct for skews in the sample, and produce a more politically and socially representative estimate of ethnic minority vote choices, and changes in these choices.
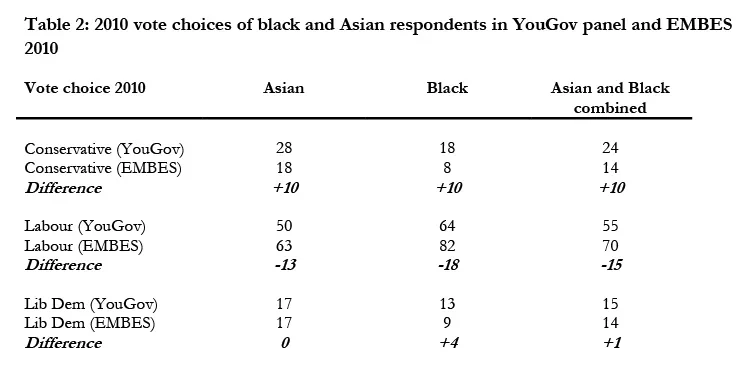
The Survation study did not provide the 2010 vote choice data we need to undertake these analyses in their report for British Future, making it hard to test for the biases mentioned above, so we turn instead to data from YouGov, another web panel survey company. YouGov provided us with 2010 and 2015 vote choice data for 4,221 ethnic minority respondents drawn from a larger representative sample of YouGov respondents about their 2015 vote choices shortly after the May general election. The results are shown in table 2 below.
In table 2 we compare the 2010 vote choices reported by black and Asian respondents in the YouGov panel with the reported choices of respondents from the same groups in the more comprehensive EMBES survey.2 There is a substantial difference in the reported political behaviour of both groups. Levels of Conservative voting are ten percentage points higher among black and Asian YouGov respondents than respondents in the more comprehensive EMBES survey. Differences in reported Labour voting are even larger – 13 points lower among Asian YouGov respondents than Asian EMBES respondents, and 18 points lower among black YouGov respondents than black EMBES respondents. This strongly suggests that the ethnic minority respondents found in the internet surveys are not representative of the overall ethnic minority electorate – 2010 YouGov respondents are much more likely to report a Conservative vote, and much less likely to report a Labour vote, than respondents from the same groups who were interviewed by EMBES in 2010.
The kind of ethnic minority respondents who answered YouGov surveys thus look to be less Labour leaning, and more Tory leaning, than the overall minority population. It is likely that these skews would also be found in the Survation data as well, as Survation employ a similar kind of web panel sample. However, it is also possible that the Tories have made further progress with this group since 2010, which would be important evidence that Conservative efforts to appeal to minorities were indeed helping to "close the gap" at least with this subset of minority voters who were already more willing to consider Conservative voting. In Table 3, we take a look at the change in vote choices among ethnic minority YouGov respondents between 2010 and 2015, also including the "mixed/multiple" and "other" groups where a comparison with the 2010 EMBES was impossible.
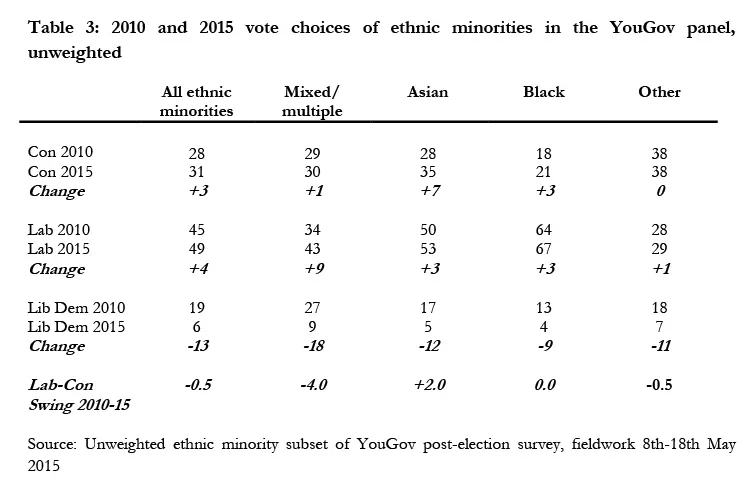
There is little evidence of any net shift from Labour to Tory among the YouGov ethnic minority sample. Instead, both main parties gain equally from the collapse in support from the Lib Dems, leaving the "gap" in 2015 roughly the same as it was in 2010. While the Conservatives do make modest advances in vote shares with all minority groups, and a solid seven point advance with Asian voters, there is no net swing from Labour to Tory overall, with a modest two point swing to the Tories among Asian voters more than balanced out by a four point swing away from the Conservatives among mixed voters. The Conservatives have not "closed the gap" with YouGov ethnic minority respondents since 2015 – their 18 point overall disadvantage is almost identical to the one recorded in 2010.
However, the same kinds of sampling biases that have lead to an over-statement of Conservative support in the 2010 YouGov data could also lead to an under-statement of change in support since 2010. The sections of the minority population which are most willing to change support between elections might also be those which are least willing to participate in surveys. We can attempt to correct for this by reweighting responses to be as politically and socially representative as possible. This cannot fully resolve the issues generated by biases, but applying such weights at least makes the sample of minorities a closer approximation of the overall ethnic minority population. Two kinds of corrections are applied. Firstly, demographic weights to make the data representative by ethnicity, age, gender, and region, derived from ONS statistics Secondly, political weights to make the data representative of 2010 vote choices, derived from analysis of YouGov internal data at the time of the 2010 election and EMBES vote report (full details of the weighting procedure provided in the appendix below).
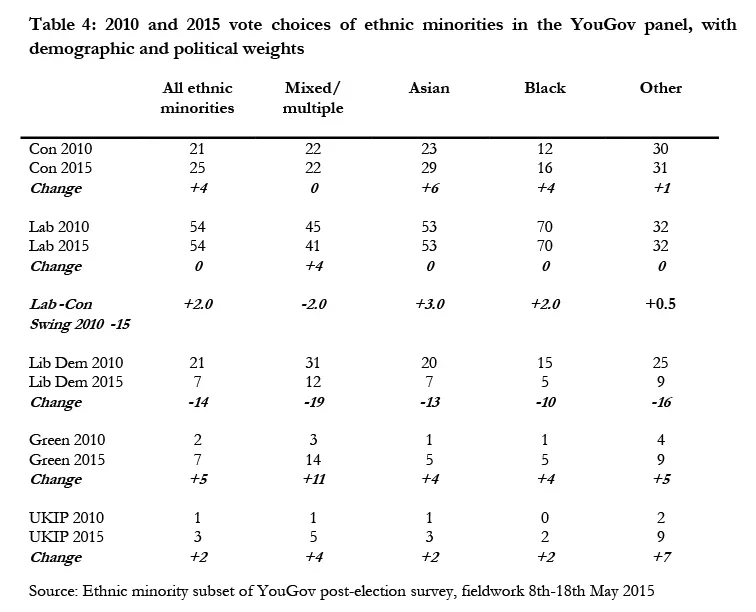
The fully weighted data, shown in table 4, does suggest a modest Conservative advance amongst minorities. The proportion backing Cameron's party rises four points from 21% to 25%. This is a notable achievement given the party's historical struggles with minority voters, and the overall swing to Labour nationally. It does seem that the Conservatives are starting to make modest progress with all ethnic minority groups, and in particular we, like British Future find a particularly strong rise in Tory support from Asian voters. Yet the overall pattern is one of modest advance, not dramatic shifts. There is no evidence of any decline in Labour support overall – they achieve a share of 54% in both years. This is, however, an under-performance relative to the party's national advance, and suggests that Labour have not benefitted from the collapse in ethnic minority Liberal Democrat support (down 14 points overall) in the way they would have hoped.
Instead it is the Greens who make the biggest advance with minority voters, more than tripling their vote share to 7%, with a particularly big surge among the young and rapidly growing mixed heritage electorate. UKIP support also grew among all minority groups, although at 3% the party's support remains dramatically weaker among ethnic minorities than among white voters.
Evolution, not revolution
Our results do not support the idea of a dramatic shift in ethnic minority voting behaviour. Instead, the pattern we find among Britain's growing minority communities conforms with that found in the white majority in England and Wales: incremental Conservative and Labour advance, a collapse in Liberal Democrat voting, and a surge in support for minor party entrants. Once we allow for the political and social skews in internet survey samples, we find ethnic minority voters choices changed between 2010 and 2015 in much the same way as the white majority.
There are lessons here for both Labour and the Conservatives. The Tories' efforts to appeal to minority voters do seem to be bearing some fruit, particularly among the more prosperous and middle class minorities, but the advance to date is modest and much work is still needed to "close the gap". Labour still receive the majority of ethnic minority votes, but they were unable to grow their support among minorities, despite the collapse of the Lib Dems whose opposition to the Iraq war had won them many ethnic minority votes in the mid 2000s.
Our evidence fits with other research suggesting that traditional partisan loyalties to Labour are fading away among ethnic minority voters, producing an electorate more willing to "shop around" and consider a range of other political options, including the Conservatives, the Greens and UKIP. British Future are therefore right to conclude that the ethnic minority vote is increasingly "up for grabs", even if Labour still has a large starting advantage. All parties will need to work hard to appeal for this growing and politically crucial vote in future elections, and much more targeted research is needed to understand ethnic minority voters' concerns and priorities.
Full tables for the YouGov data used can be found here and here.
Footnotes:
1. EMBES conducted thousands of face to face interviews with ethnic minority voters in their homes, including interviews in native languages with respondents who were less confident in English.
2. We do not report differences for the mixed and other groups, as these were not sampled in EMBES
Appendix: Weighting
Demographics: YouGov used targets derived from the ONS to ensure the data were demographically representative. The four target weights were age, gender, region and ethnicity
| Gender | |
| Male | 50.1 |
| Female | 49.9 |
| Age | |
| 18-34 | 48.7 |
| 35-54 | 39.6 |
| 55+ | 11.7 |
| Ethnicity | |
| Mixed | 15.6 |
| Asian | 53.6 |
| Black | 23.7 |
| Other | 7.1 |
| Region | |
| London | 40.7 |
| Midlands | 18 |
| North | 13.5 |
| South | 23.5 |
| Scotland | 3 |
| Wales | 1.3 |
2010 Vote: To weight the data by 2010 vote, YouGov used data from two sources; the 2010 EMBES as well as YouGov’s internal analysis of post-election data in 2010. The EMBES survey has 2010 vote for five ethnic minorities (Pakistani, Bangladeshi, Indian, Caribbean and African) and these five groups make up 58% of ethnic minorities in Britain. For the remaining groups (Mixed, Chinese and “Other”), who make up 42% of the ethnic minority population of Britain, YouGov used internal analysis of 2010 data to derive targets. The table below outlines the 2010 vote of these two groups and the combined weights for all ethnic minorities in Britain.
| Group | Population | Con | Lab | Lib | Other |
| Indian, Bangladeshi, Pakistani, Caribbean, African | 58 | 14 | 72 | 13 | 2 |
| Mixed, Chines, Other | 42 | 30 | 32 | 31 | 7 |
| Combined | 100 | 21 | 54 | 21 | 4 |
YouGov uses rim weighting and included the above targets for all five variables (four demographics and 2010 vote) to make the overall sample representative of ethnic minorities in Britain. Please note, individual ethnicities are not representative, rather the overall sample of ethnic minorities as a whole. It is also important to note that there is potential for the 2010 targets sourced from YouGov’s internal data may have similar biases to the data produced by Survation in 2010. Therefore the target percentages for this 42% are indicative rather than definitive of 2010 but provide the best possible estimate of 2010 voting for EM groups not included in the EMBES survey.
| 2010 Vote | |
| Con | 14.7 |
| Lab | 37.8 |
| Lib | 14.7 |
| Other | 2.8 |
| DNV | 30 |