To coincide with the run up to the general election, we'll be bringing the power of YouGov Profiles to politics
YouGov Profiles has got off to a flying start as a groundbreaking media planning and market research product (see yougov.co.uk/profiler for the free to use app) but until now it has not been applied to politics. To coincide with the run up to the general election, we’re announcing today that we will make the YouGov Profiles data available to every prospective parliamentary candidate from every political party, to help them understand the people they are aiming to serve.
What is YouGov Profiles?
In the UK alone, YouGov conducts over half a million online surveys a month with its panel of 400,000 British respondents up and down the country. In between surveys, members of YouGov continue to share their opinions, likes and dislikes on the YouGov website and many choose to share their online activity when they’re not even with us. This means that over time we have built up an incredibly detailed picture how different attributes and opinions correspond to each other - showing what you think really reveals about you.
YouGov Profiles allows creative agencies and media planners to identify a target group and get a full 360 degree picture of them - their demographics, lifestyle, likes and dislikes, media habits, prevailing attitudes, favourite celebrities, online behaviour and much more.
In time for the election campaign, YouGov will produce constituency level profiles for all the constituencies in Britain, to help put candidates for MP in touch with the people they are bidding to represent.
Why would YouGov Profiles be relevant to a political campaign?
A political campaign is the ultimate marketing campaign - in which the final result is brutally clear but in which most candidates have to go about it with remarkably little information about their constituents.
Many politicians probably rather enjoy this feeling of ‘flying blind’ - they prefer to think they have a particular gift for understanding the voters, and you’ll often hear politicians publicly dismiss the value of opinion polls (although we know they all look at them!).
However, at a time when MPs are seen as being more ‘out of touch’ than ever before, and confidence in the political process is at an all time low, we think that giving candidates some hard data about what their constituents are really like can only help the democratic process. Nothing beats going door to door and talking to voters directly to get a sense of what people are thinking, but it is very hard to know what proportions they come in or how the constituency breaks down overall on a particular issue. And what about the people who don't answer the door, or write in to their MP? They are constituents too. Better information can only bring the electors and the elected closer together.
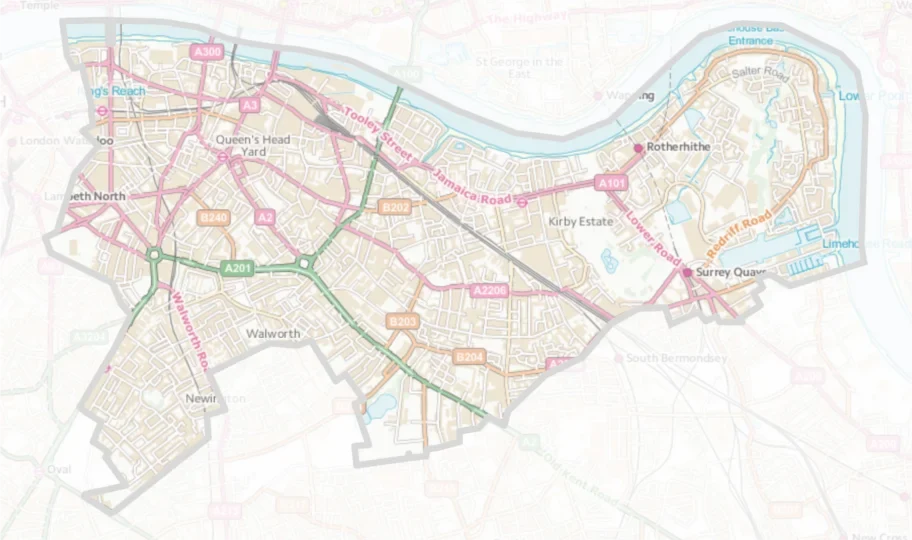
Preview case study: Bermondsey and Southwark
To give a sense of the kind of data we will be offering and to show how it might be useful, we’ve taken a look at the central London constituency of Bermondsey and Old Southwark. It is where our launch event took place last night (on HMS Belfast), and is also the home of City Hall, the office of our special guest Mayor Boris Johnson.
It’s been a Liberal Democrat stronghold ever since the notorious by-election of 1983, in which Simon Hughes beat Labour’s Peter Tatchell in an election dominated by innuendo about Mr Tatchell’s sexuality. Based on demographics alone, you would expect it to be a Labour seat - over 40% council tenants, over 20% Afro-Caribbean - but it is also a rapidly changing area, with highly expensive developments lining the river banks all the way to Rotherhithe, and the areas close to Canary Wharf being popular with bankers and professionals.
The Heygate Estate in Elephant and Castle has finally made way to a new development which has reignited familiar controversies about the benefits of urban regeneration. From the hipster streets of Borough Market in the West to Rotherhithe in the East, it embodies all the contradictions of a modern urban area.
The big issues
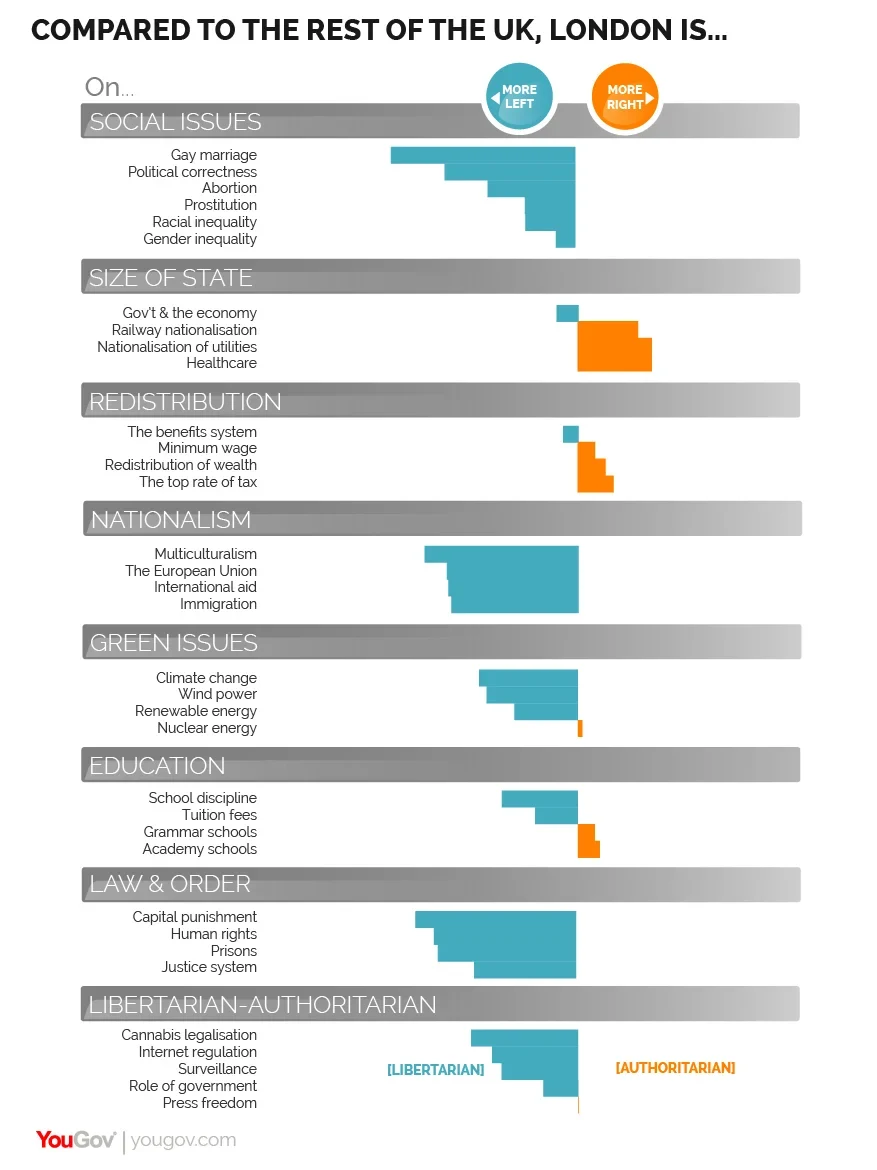
We’ve added a new dataset to YouGov Profiles, where we ask all YouGov members to share their position on 50 of the big political issues. Respondents answer each one on a five point scale, roughly from Left to Right, and then say how important that issue is to them personally. The results provide a useful measure of how groups differ from each other in aggregate.
To understand any London constituency you first have to understand how London differs from the rest of the country. The graphic below shows how the average score on each issue within Greater London compares to the national picture.
The first thing to notice is that London is to the Left of the country on most issues. The difference is most pronounced on social issues such as gay marriage, the issues we group as questions of ‘nationalism’ - including immigration, the desirability of mulitculturalism, the EU and International Aid - and questions of Law and Order. The fact that today’s Londoners are so much more progressive on the justice system and the role of prisons is testament to the increased safety in the city.
However, on the two economic issue groupings, London is generally to the right of the rest of the country. The appeal of nationalising industries and centralising state power is not as strong in the capital, and Londoners take a slightly more centrist position on redistribution of wealth (despite living in the most unequal part of the country).
It seems that in this centre of enterprise, voters are slightly more comfortable with the involvement of the private sector: in healthcare and even in schools (support for academy schools is slightly higher in London). This coheres with the more libertarian stance of Londoners in general - on cannabis legislation, internet regulation and surveillance, Londoners are more likely to want to be left alone to do as they please.
Turning to how Bermondsey compares to London, the picture is broadly as you would expect. On the majority of issues, the voters of Bermondsey are to the left of London. But the complex makeup of this constituency results in a varied effect.
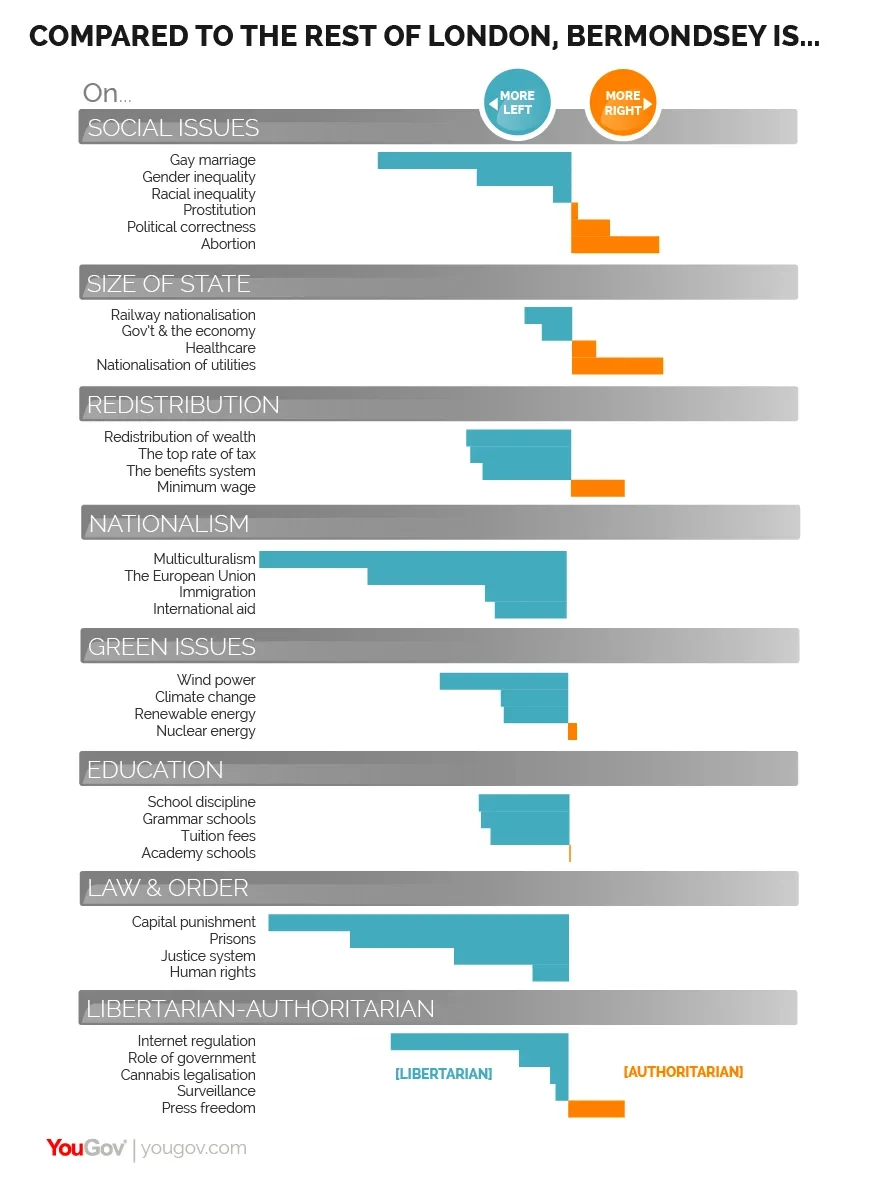
Perhaps as a result of large immigrant population there is a more nuanced position on social issues, and the higher than average proportion of poorer people and people on benefits shifts the centre of ground to the Left on redistribution of wealth, the top rate of tax and the benefits system.
But the standout areas where Bermondsey differs from London are in its attitude to multiculturalism (in favour), the justice system (liberal) and internet regulation (a symptom of the younger urban demographic that dominates this constituency).
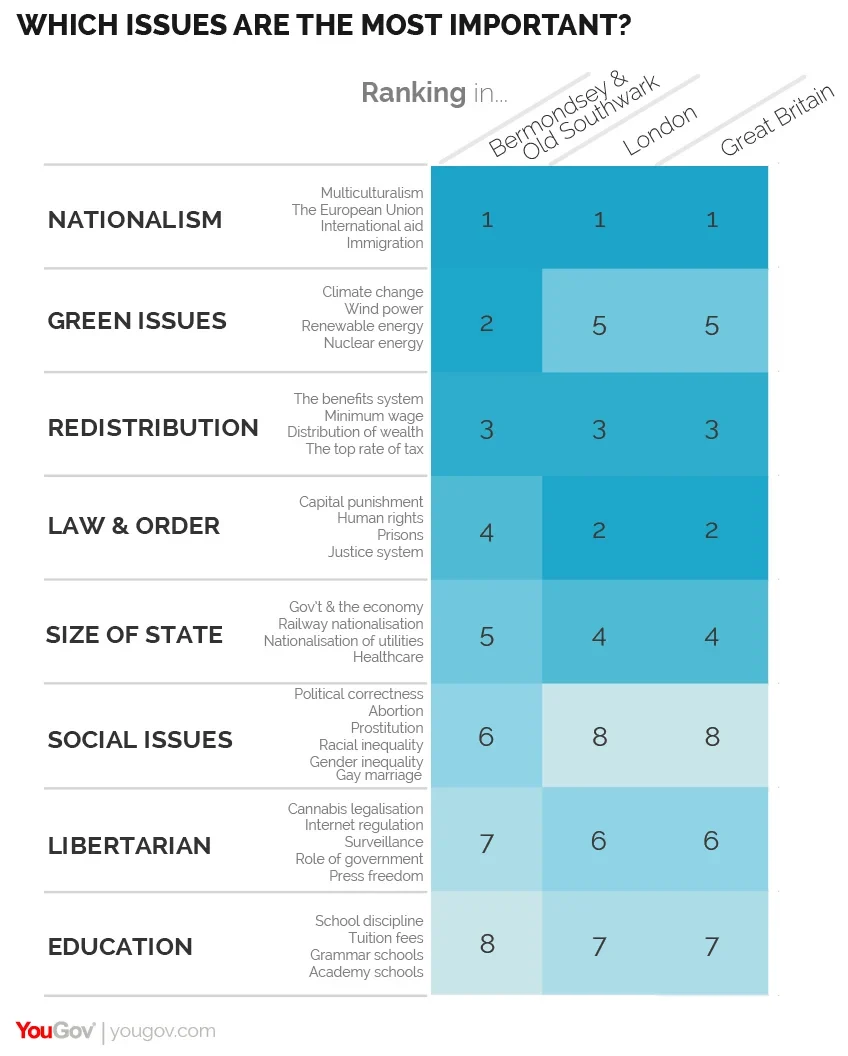
Below, the image shows the relative priority given to these issues. This is a reminder that despite all the differences, the ranking of issues tends to be similar across all groups. Green issues get more airtime in Bermondsey than elsewhere, but even in such a left-leaning urban constituency, issues such as immigration and the EU will continue to dominate on the doorstep in this election campaign.
Life outside politics
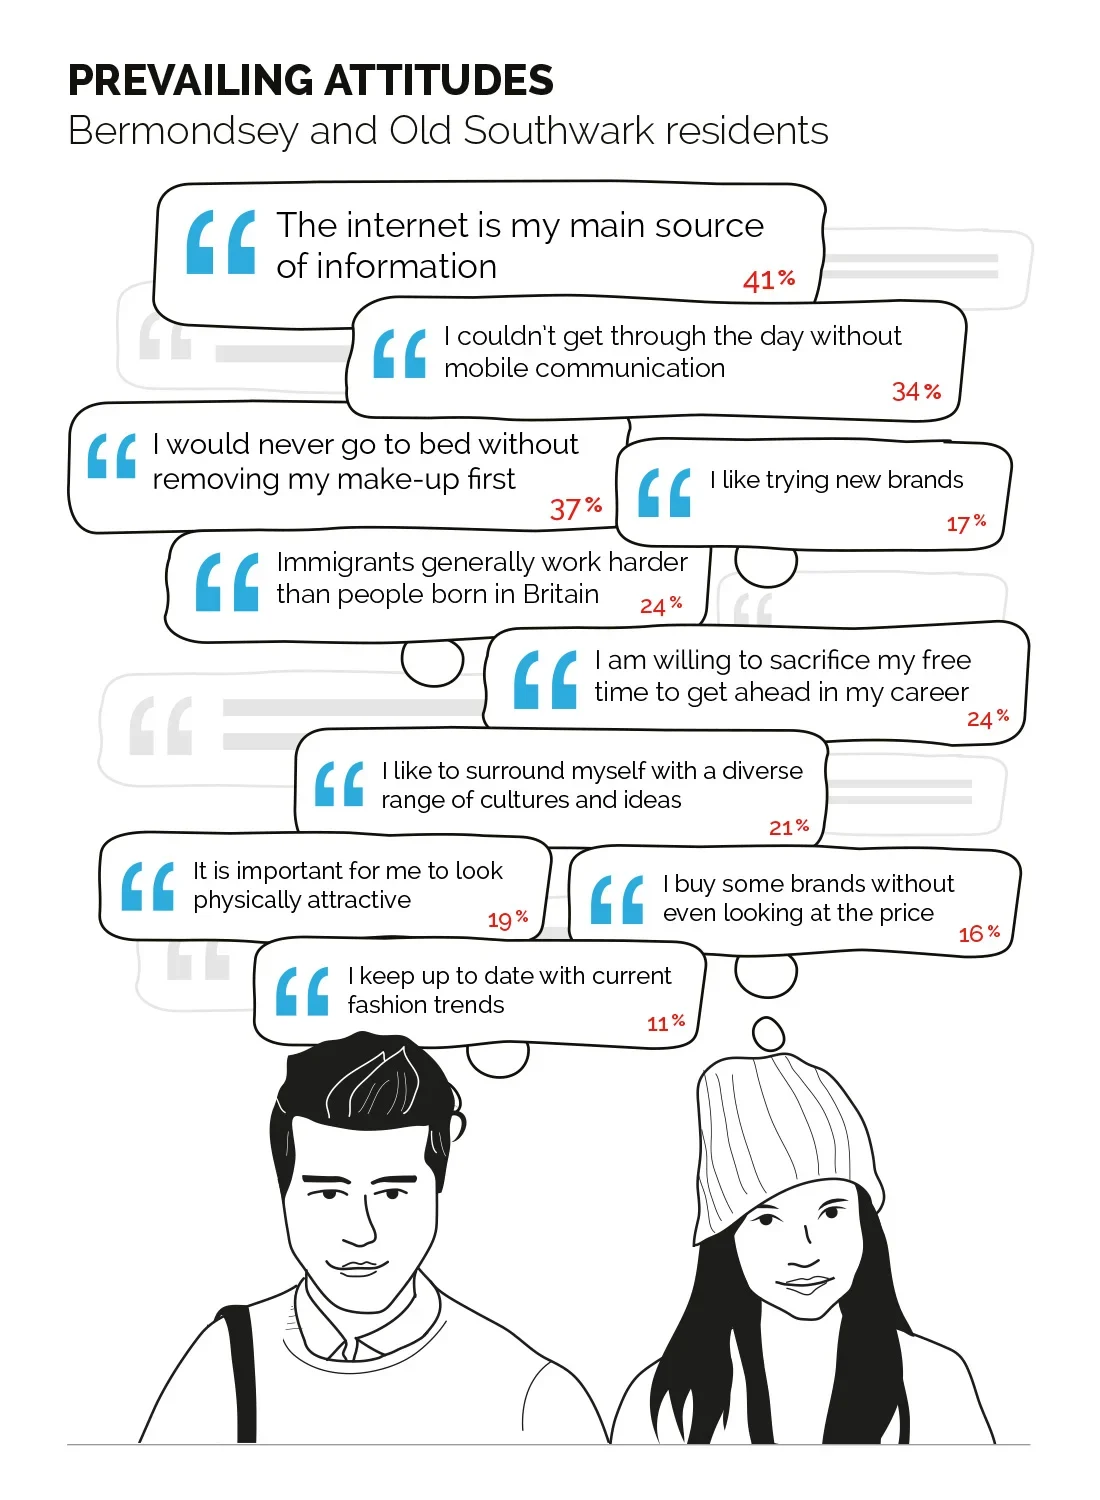
For a political candidate in the midst of a campaign, it can be hard to remember what life is like outside politics for most people. Here, YouGov Profiles data can help. Below are the attitudes that are particularly prevalent among voters in Bermondsey. There’s only one that is even slightly political - “immigrants generally work harder than people born in Britain.”
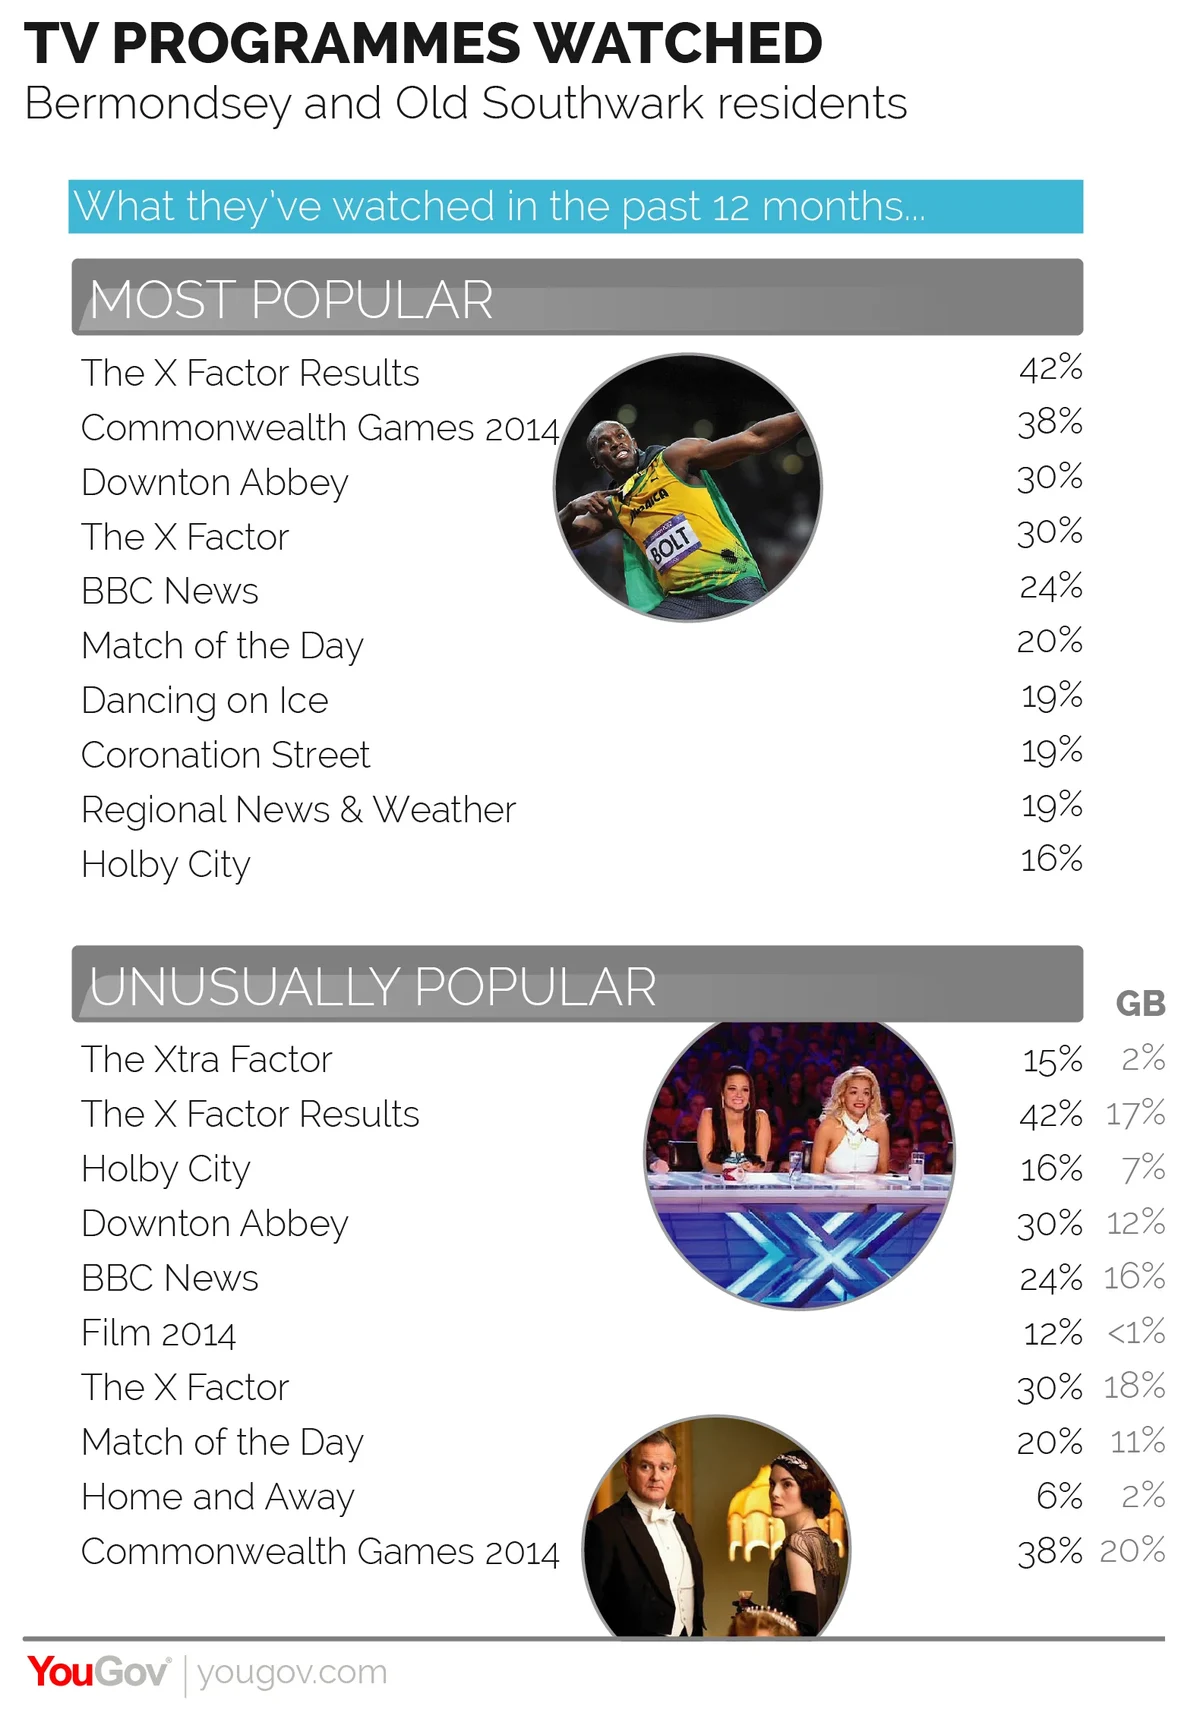
It’s a similar story when you look at their taste in television. The two charts in the 'TV programmes watched' graphic show the top ranking overall programmes among Bermondsey voters, as well as the ten that most overscore when compared to the rest of the country. BBC News is the only programme on the list that could ever contain election messages.
Getting through to the voters
As with any campaign, understanding the media habits of the people you are trying to reach helps direct energy and resources to channels that have a greater chance of getting through.
For each constituency we will show the main place voters get their news, as well as granular data on what news programmes, newspapers and websites they visit.
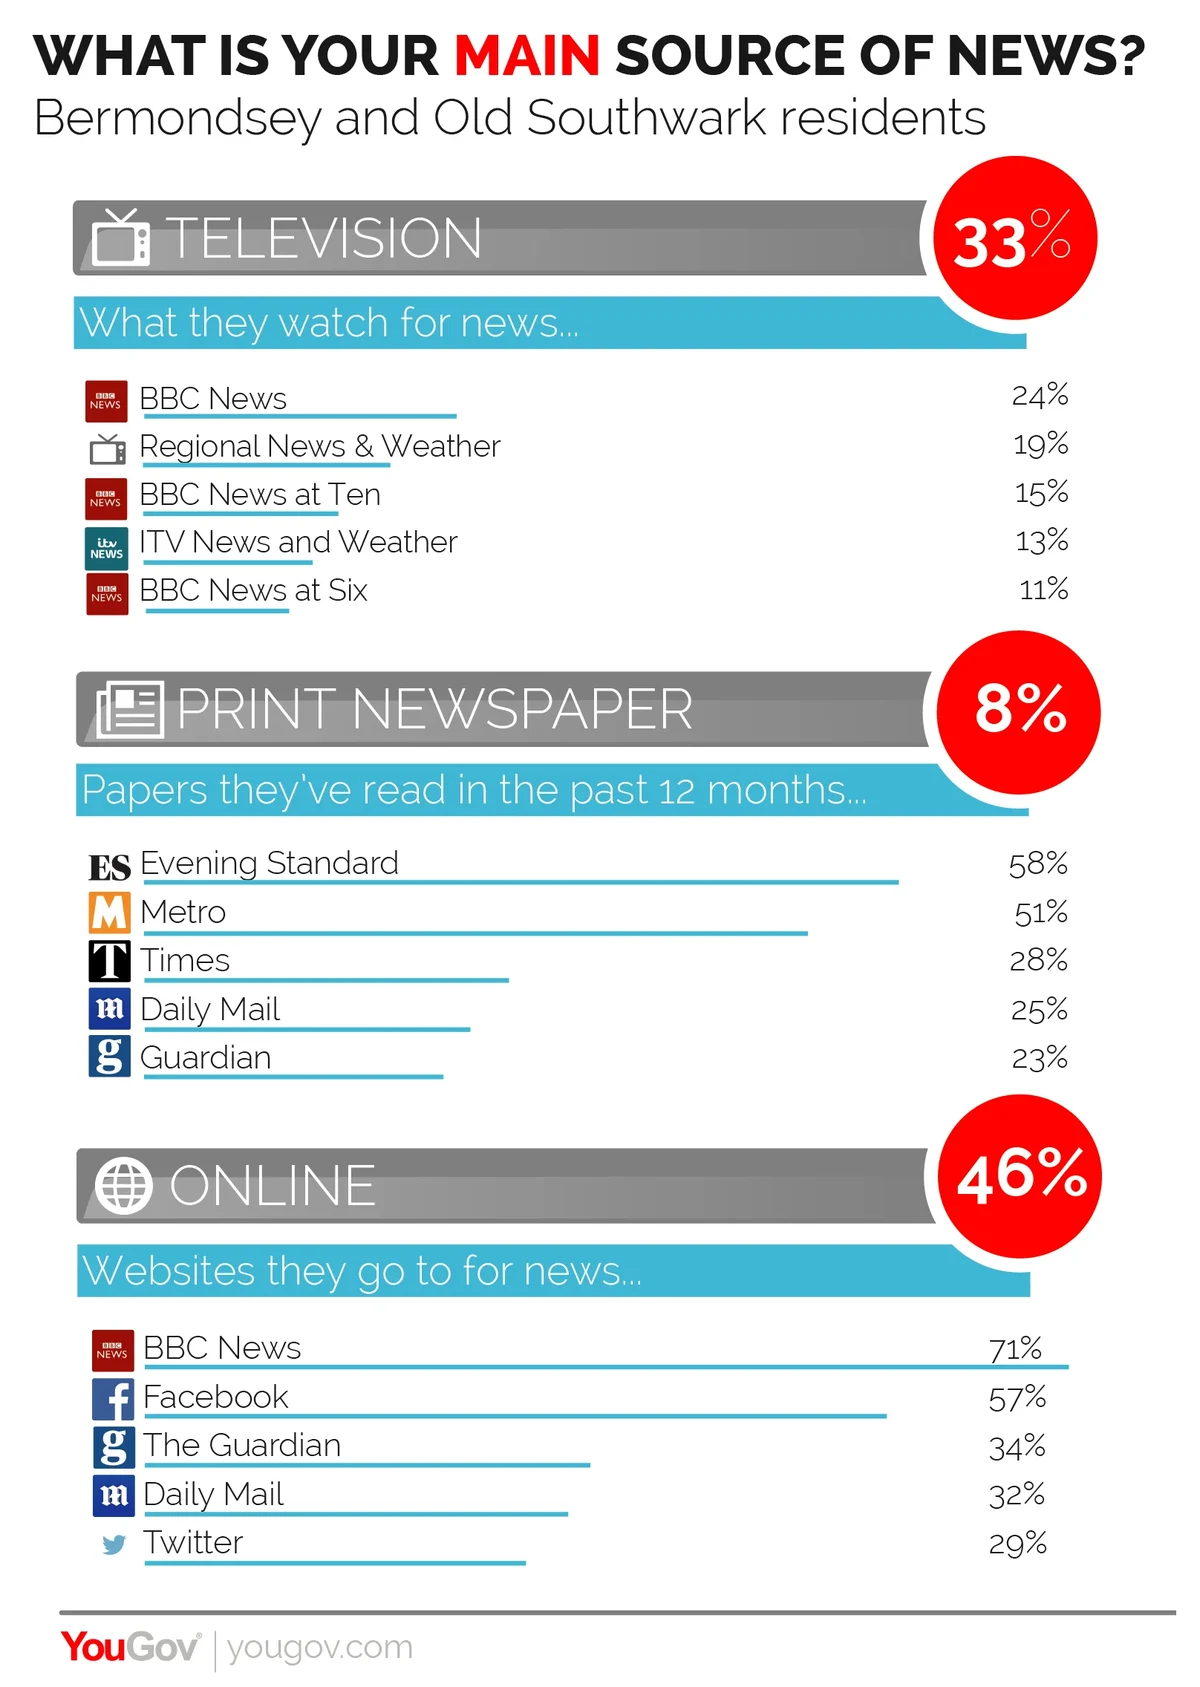
The 'Main source of news' visual shows how dominant the internet is for the voters of Bermondsey - 46% of voters there get their news mainly online. If there are newspapers to watch out for they are the Evening Standard and Metro more than any of the national papers - and even in this liberal safehouse, keep an eye on the Daily Mail online.
Methodology and May 2015 predictions
For the Bermondsey case study we used the 595 electors we have on the YouGov panel in that constituency to form the profile, but as we move into the election campaign we will be making overall projections about the outcome on May 7th.
Instead of relying on the small samples within each constituency, YouGov uses cutting-edge statistical methods for big data to make detailed projections on voting intention and policy preferences for all 650 constituencies in the UK.
The method, called multilevel regression post-stratification, or, more affectionately, “Mr. P”,was developed by Professor Andrew Gelman of Columbia University, and extended by YouGov for panel-based research. It uses hierarchical Bayesian models combining data from YouGov’s 200,000 most active panelists in the UK, who will be interviewed continuously throughout the campaign, with Experian’s database of 60 million UK households arranged into ‘mosaic’ segments, quarterly population surveys by the UK Office of National Statistics, and constituency-level voting returns.
We will be unveiling our seat by seat projections at the start of the formal election campaign.