Peter Kellner breaks down YouGov's final survey before the European Parliament elections
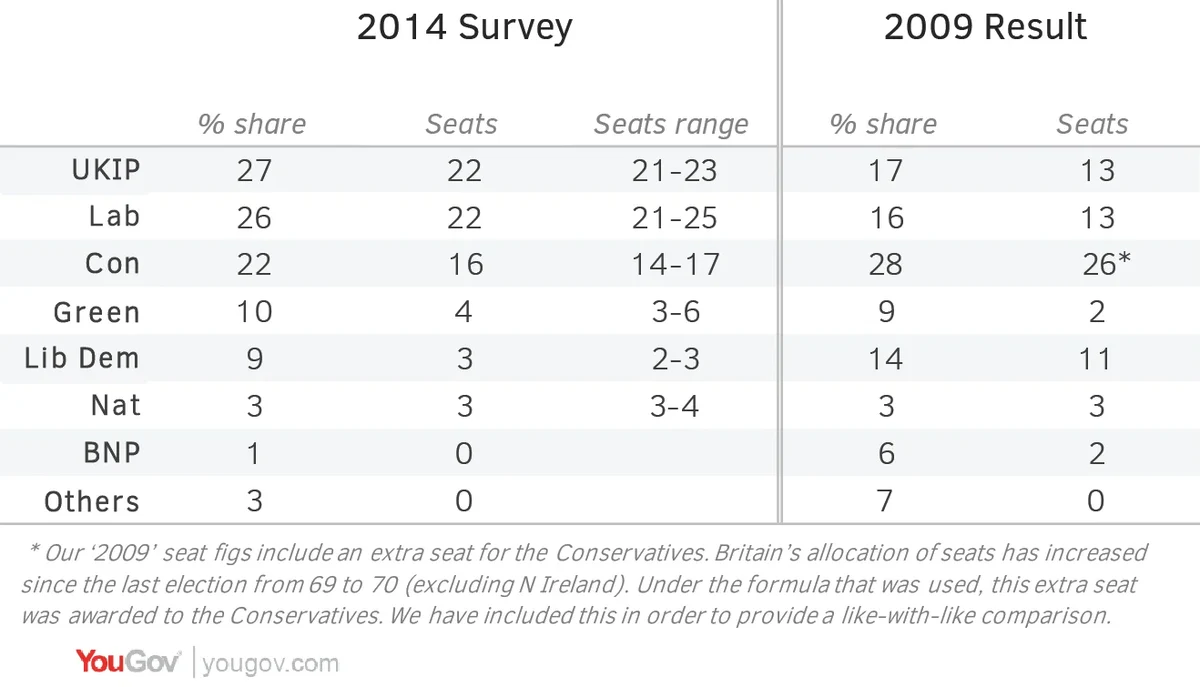
Labour and UKIP are running neck-and-neck in YouGov’s final survey for the elections to the European Parliament. UKIP’s one-point lead over Labour is within the margin of error – as is the Greens’ one-point lead over the Liberal Democrats in the battle for fourth place. The Conservatives are heading for third place – the first time they have ever done so in a national election – though they are not as far behind Labour or UKIP as seemed likely some weeks ago.
Want to receive Peter Kellner's commentaries by email? Subscribe here
The British National Party is certain to lose its two seats, as its support has crashed from 6% five years ago to just 1% this week.
The table below shows YouGov’s projection for votes and seats. The voting system, with a proportional allocation of seats within each region, means that the final seat distribution in some regions is hard to predict. So alongside our central seat projection is a range. There is an outside chance that the UKIP could narrowly win the popular vote, while Labour ends up with more MEPs.

We obtained our results by re-questioning more than 6,000 people we initially surveyed in late April. For this final poll, we showed each respondent a full list of parties standing in their region. We asked people how they would vote, and also how likely they were to vote, on a scale from 0 (definitely will not vote) to 10 (definitely will vote, or have already voted by post). To arrive at our final voting figures we used the proportional turnout method. Everyone who said 10/10 on the likelihood to vote question was counted as 1, those who said 9 were counted as 0.9 and so on.
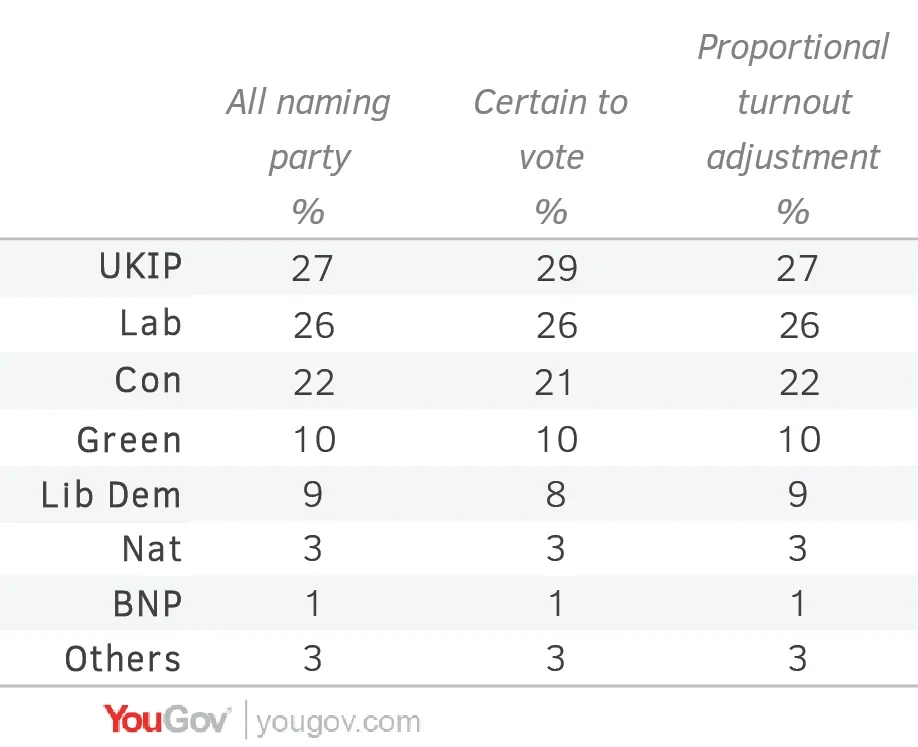
Here are our results by three different criteria: everyone naming a party, all those saying they were certain to vote or had already voted, and the proportional method we used:

Had we used the ‘certain to vote’ results (in line with other polling companies), our figure for UKIP would be two points higher, while the Conservatives and Liberal Democrats would both have been one point lower.
It is a matter of judgement how to adjust for turnout in an election where most people don’t vote. We have plumped for the proportional method for two reasons. First, it seems odd to count someone who says 9/10 in the same way as those who say they are certain not to vote. Secondly, and more pragmatically, we found in both 2004 and 2009 that our ‘certain to vote’ figures slightly overstated UKIP’s actual share of the vote. But this is one of those choices on which people may legitimately differ.
By re-interviewing the same people, we are able to explore how support has changed over the past 3-4 weeks. Ninety per cent of respondents gave the same voting intention on both occasions, while 10% changed party, or moved to or from ‘don’t know’ or ‘would not vote.’ As normal, the net changes have been much smaller, with many of the individual movements cancelling each other out.
That said, there have been some notable shifts. Both UKIP and Labour now stand two points lower than they did in late April, while the Conservatives have gained one point. But the biggest change has been a marked increase in support for the Greens, up from 7% to 10%. If our figures are exactly right, they have now overtaken the Lib Dems. It’s not because Nick Clegg’s party has lost support during the course of the campaign: their losses and gains almost exactly cancel each other out. Rather, the Greens have gained three votes for every one they have lost since late April. Those gains have come from every part of the political spectrum, but with slightly more from Labour and those who made up their minds late, than from other parties.
The battle for fourth place is too close to call with certainty; but when the votes are counted on Sunday night, the performance of the Greens may be one to watch.
Image: Getty
See the full YouGov/ The Sun / The Times survey results
Want to receive Peter Kellner's commentaries by email? Subscribe here


