
Whilst the majority think MPs aren’t representative of the wider population in terms of gender or ethnicity, official steps to improve things aren’t widely backed by Britons
Come December 13th the UK could have its most diverse Parliament ever, with up to 67 ethnic minority MPs expected, and a record number of female candidates standing. But new YouGov research shows that most Britons (68%) believe that the Commons is still not representative of the British population - although there is widespread opposition to putting official measures in place to improve matters.
Most believe MPs aren’t representative of Britain
Diversity is clearly a problem for Parliament, as fewer than one in five (18%) Britons believe MPs are representative of the wider population. The Conservatives suffered worst of the four parties we asked about. Some 64% believe that Conservative MPs are not representative, compared to 57% who think the same of Labour MPs, 60% about Lib Dem MPs and 50% of SNP MPs.

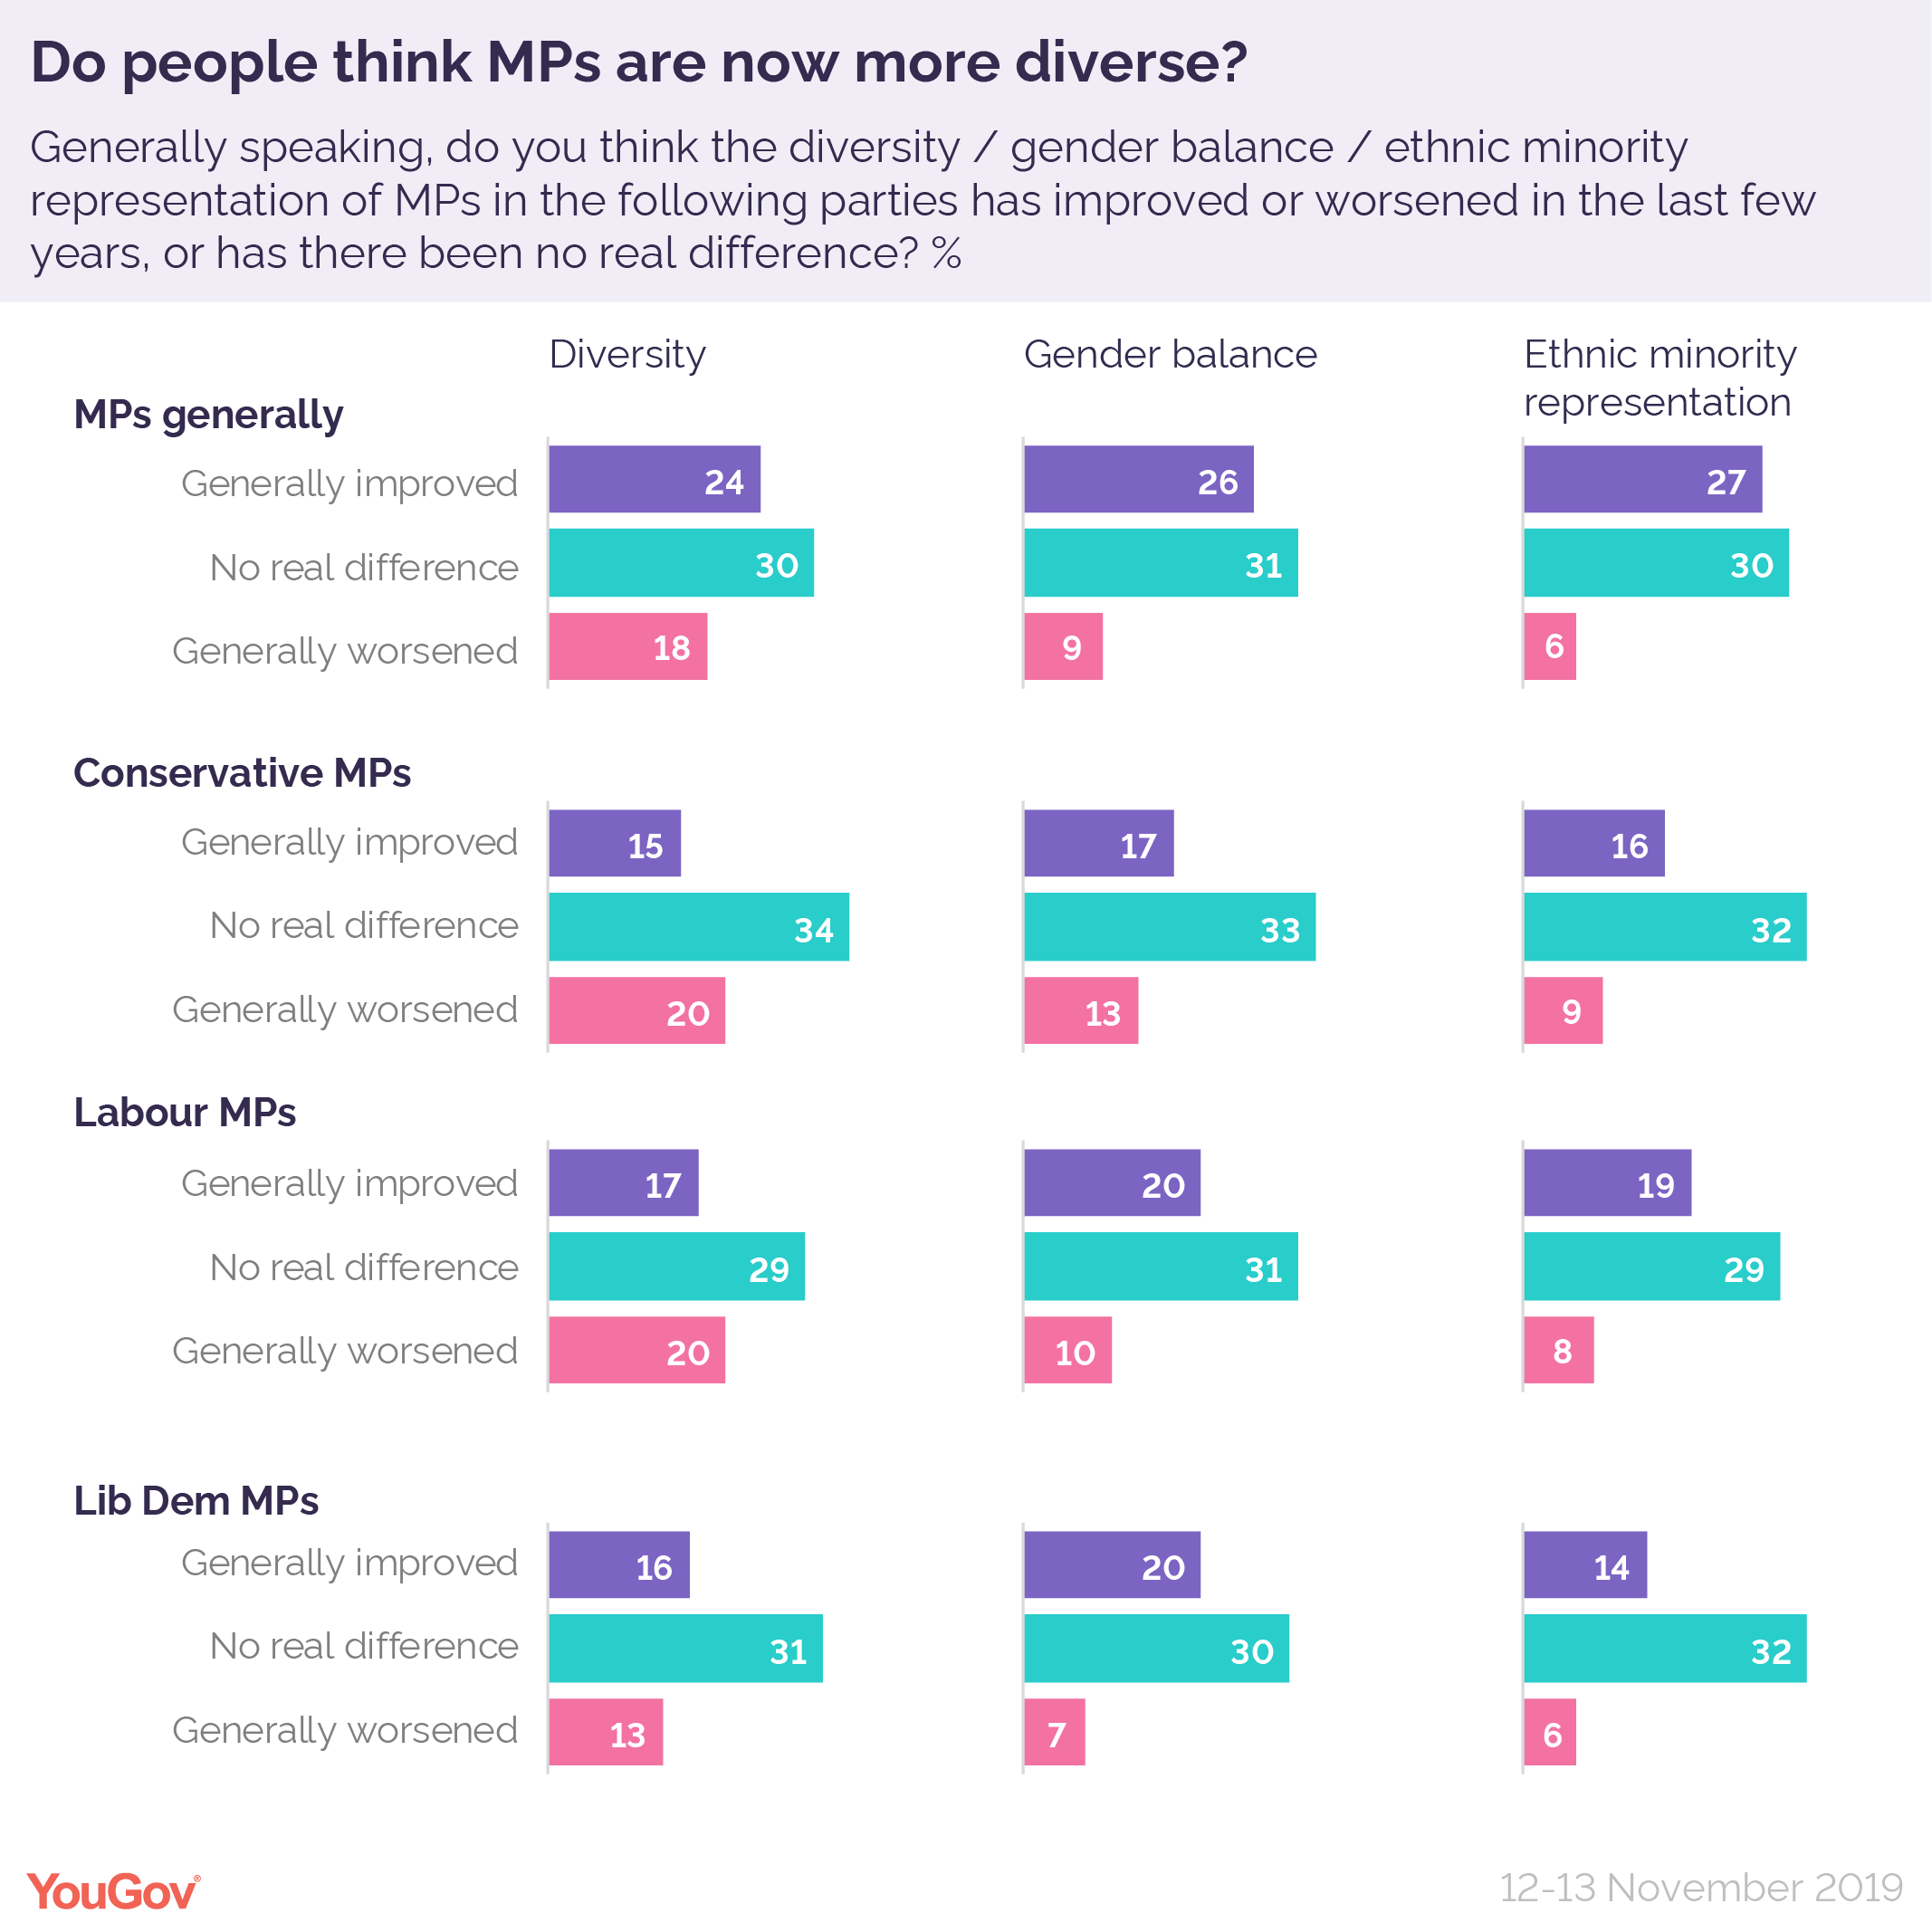
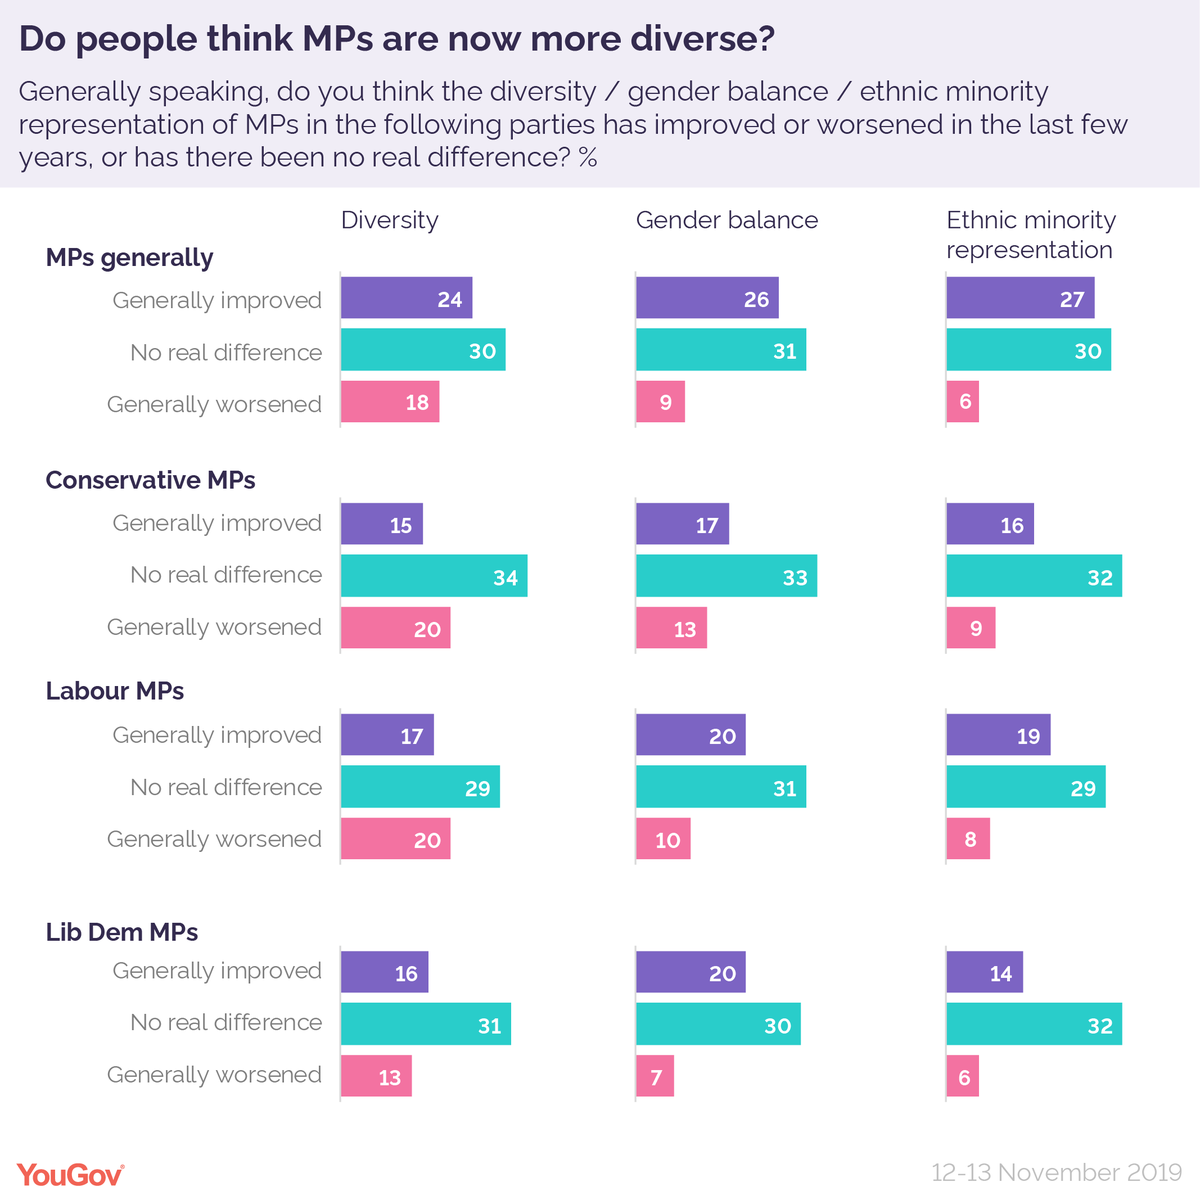
A quarter (24%) of Britons in our survey believe general diversity of MPs has generally improved in the last few years, but overall it’s not good news: a third (30%) aren’t seeing any real difference, and a fifth (18%) think it’s worsened.
Amongst the parties listed, less than one in five (15%) think diversity amongst Conservatives has improved, just 16% believe things are moving in the right direction among the Lib Dems, 16% for SNP and 17% for Labour.
Looking at the gender balance of these parties, more are likely to say it has improved overall (26%) than within individual parties. Some 20% say the gender balance has improved amongst Lib Dem and Labour MPs, and 17% say the same for Tory MPs. Around a tenth think the gender balance has worsened overall (9%).
According to 27%, ethnic minority representation has improved overall, whilst around one in seven identify think the same of the Tories (16%), Labour (19%) and Lib Dem (14%) MPs.
Can things be improved?
Although the majority are not seeing improvements, there is significant opposition to official measures to rectify the problem.
Around two in five oppose using methods such as gender quotas (41%), all-women shortlists (46%) and lists of preferred ethnic minority candidates (39%) to select parliamentary candidates.
Around three in five 2017 Conservative voters are opposed to each of these (with opposition ranging from 57% to 64%) followed closely by Liberal Democrats (with opposition ranging from 43% to 55%).
Only around one in ten Britons support these measures overall (10% support gender quotas; 10% all-women shortlists; 14% preferred minority background candidate lists).
Labour voters from 2017 are more likely to endorse these ideas (20% support gender quotas; 17% all-women shortlists; 24% preferred minority background candidate lists).
Younger people also tend to support the steps more than older Britons. At least a fifth of 18 to 24 year olds support each of the measures (26% support gender quotas; 19% all-women shortlists; 28% preferred minority background candidate lists) whilst at least half of those aged 65 and over oppose each of them.
Just one in five think diversity is important
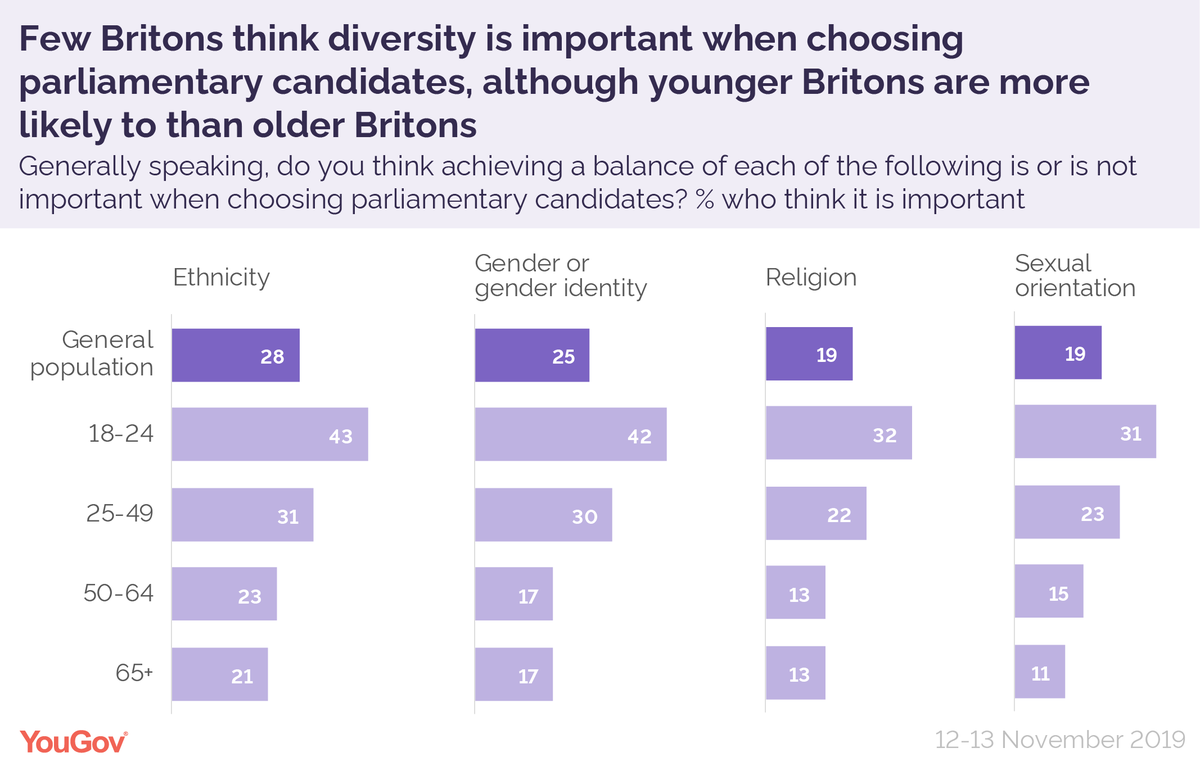
YouGov asked if the following traits were important when choosing parliamentary candidates: gender or gender identity, ethnicity, religion and sexual orientation. The results perhaps highlight why there’s reluctance to put official measures in place to improve diversity.
At least three in five Britons believe gender or gender identity (62%), ethnicity (59%), religion (68%) and sexual orientation (68%) are not important when selecting prospective MPs.
Just 28% considered ethnicity important, closely followed by gender (25%), religion and sexual orientation (19% each).

Those aged 65 and over are half as likely to consider each of these aspect as important compared to 18 to 24 year olds: gender or gender identity (17% of those over 65 versus 42% of 18 to 24 year olds), ethnicity (21% versus 43%), religion (13% versus 32%) and sexual orientation (11% versus 31%).
Men are more likely to say each of these traits are not important compared to women, with the largest differences occurring with ethnicity and religion (9% difference in each). Men are also the most likely to say religion is not important (73%) whilst two-thirds of women (66%) think sexual orientation isn’t important.
Photo: Getty


