With a Christmas election confirmed, YouGov has run a mega-poll to reveal how the public intends to vote, broken down by age, gender and educational background
A standard poll may have a sample size of around 2,000, but YouGov has questioned 11,000 people over the past couple of weeks on how they intend to vote in the upcoming election. This allows us to delve deep into the different age groups, genders and educational backgrounds to understand the dynamics which will shape the election.
Age
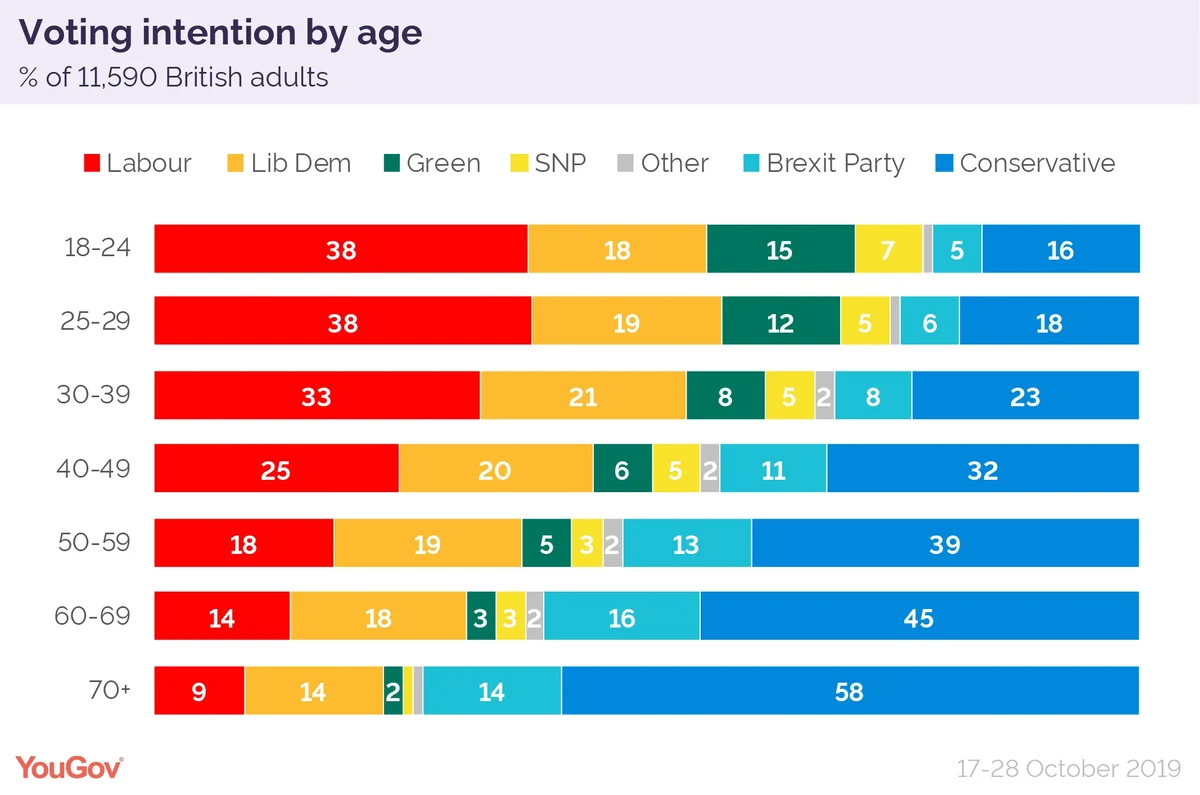
In the 2017 general election age became a clear dividing line in British politics: older voters overwhelmingly voted Conservative and younger voters backed Labour.
The data shows that there are still some clear patterns along these lines, although the waters are somewhat muddied by a move away from two-party politics.

The Conservatives are polling best amongst older voters, with 58% of those aged over 70 backing them, compared to just 16% of those aged from 18 to 24. However, they are down quite considerably from the last election amongst older voters as many have moved to the Brexit Party.
In total 14% of voters aged over 70 will back the Brexit Party, as well as 16% of those aged between 60 and 69. However, just like the Tories, they are struggling amongst young voters - just 5% of those aged from 18 to 24 support them.
For Labour this trend is reversed. They are still polling well amongst young voters, holding 38% support amongst voters under the age of 29, compared to just 9% amongst those aged over 70. However, they have lost a lot of their younger voters since the last election, most notably to the Green Party. In fact, the Greens are nearly polling the same as the Tories amongst those aged under 24 (on 15%) because of these gains from Labour.
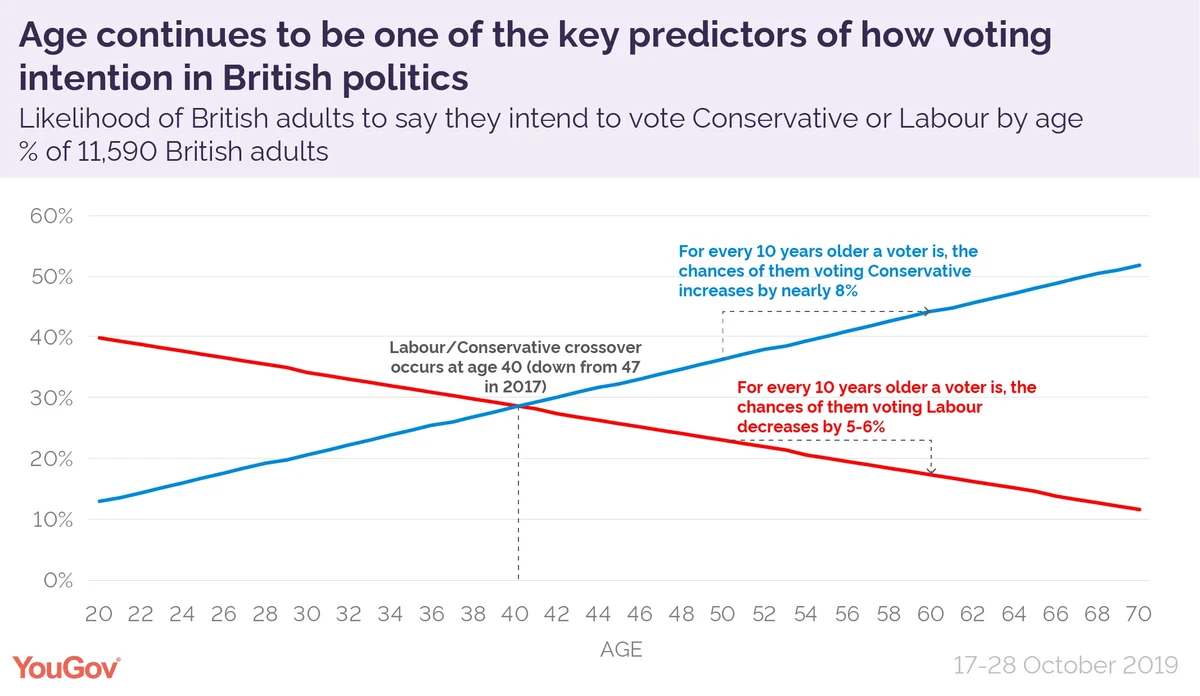
The tipping point, that is the age at which a voter is more likely to vote Conservative than Labour, is now 40 – down from 47 at the last election.
The Liberal Democrats are the only major party that doesn’t see a large age gradient, as they are currently polling at around 20% of the vote amongst all age groups.

Education
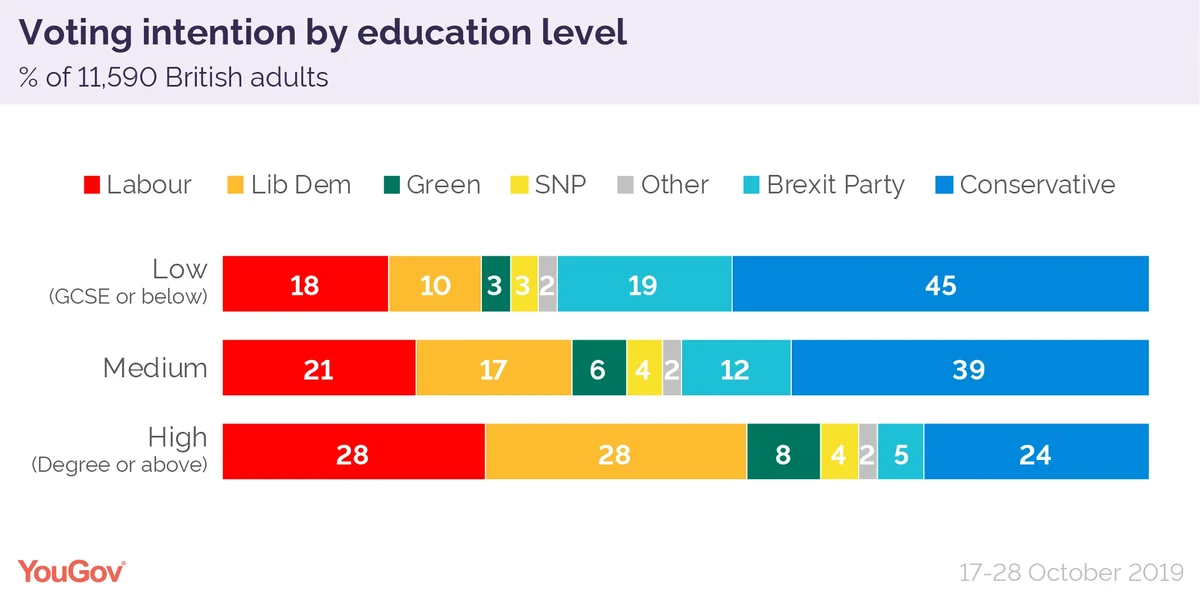
Apart from age, education has also been an increasingly prominent predictor of voting behaviour, having been an interesting divide in both the last election and the EU Referendum.

And similar to the divide in the referendum, the Leave parties are polling better amongst people with lower levels of education, with the Conservatives and Brexit party on 45% and 19% retrospectively amongst those whose highest level of qualification is GCSE or below.
By comparison, they are polling at just 24% and 5% retrospectively amongst these with a degree or equivalent.
On the Remain side, both Labour and the Lib Dems are polling best amongst people with high levels of education. The Lib Dems are on 28% of the vote amongst those with a degree, compared to just 10% amongst those whose highest level of qualifications is GCSE or below.
Meanwhile Labour are on 28% of the vote amongst those with a degree compared to just 18% amongst those whose highest level of qualification is GCSE or below.
A portion of this trend will be related to age, as older people are less likely to have degrees, however education does seem to have an independent effect on top of this.
Gender
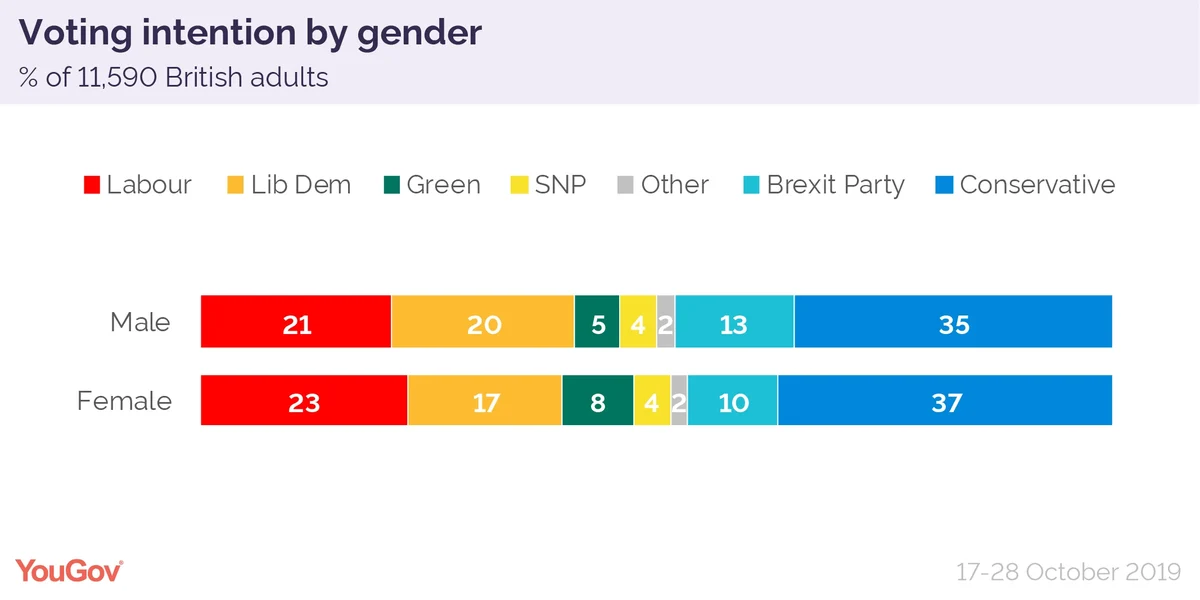
One area where there is very little difference is gender. The data does indicate that the challenger parties (the Brexit Party and the Lib Dems) might be doing slightly better amongst men, whilst the more established parties (Labour and the Lib Dems) are doing slightly better amongst women.
However, these differences are very small, and not as significant as the divides we see along age and education lines.

Photo: Getty


