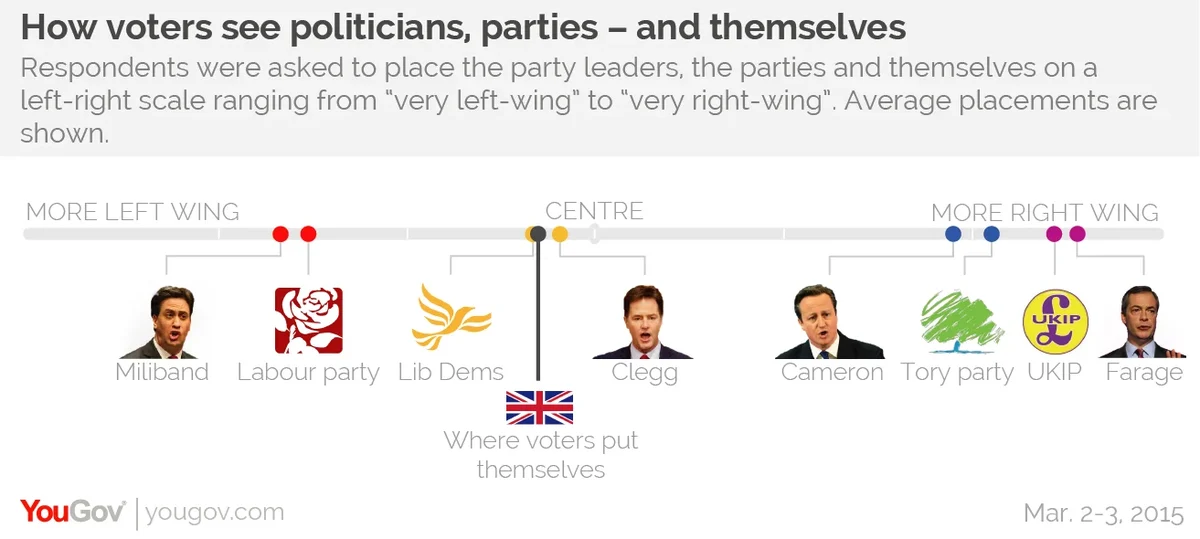
Where do people perceive the parties on the left-right spectrum? And how does that compare to how people see themselves?
For Red Box we have updated YouGov's classic map. Tomorrow we will show how it has changed over the years.

The Lib Dems are perceived to be about where the British public place themselves. If any further indication were needed that the votes are not necessarily to be had "in the centre", this is surely it.
The scores (negative is to the left, positive is to the right):
| Ed Miliband | -40.1 |
|---|---|
Labour party | -36.4 |
Liberal Democrats | -7.4 |
All GB adults (self) | -7.1 |
Nick Clegg | -4.3 |
David Cameron | 45.8 |
Conservative party | 50.7 |
UKIP | 58.6 |
Nigel Farage | 61.6 |
PA image


