
YouGov asks the public how they many seats they would assign each of the parties in the Commons if they could choose
Over the years, many people have complained about the way Britain’s electoral system translates votes into seats in the House of Commons. In 1983, SDP-Liberal Alliance won just 23 out of 650 seats, despite taking more than a quarter of the national vote. Likewise, in 2015, nearly four million people cast their ballot for UKIP but the party only received a single seat.
But what if, instead of choosing an individual MP, the British public could choose the composition of the entire House of Commons?
We asked more than 5,000 people to create their ideal House of Commons by assigning 631 seats in the House of Commons (i.e. excluding the Speaker and seats in Northern Ireland) as they saw fit. We have calculated the average seat numbers both the public at large and various groups of voters would assign to each party.
The public’s ideal House of Commons
The Labour party emerges as the largest party in the public’s ideal House of Commons, but only just. With an average haul of 223 seats, Labour are marginally ahead of the Conservatives’ average of 215.
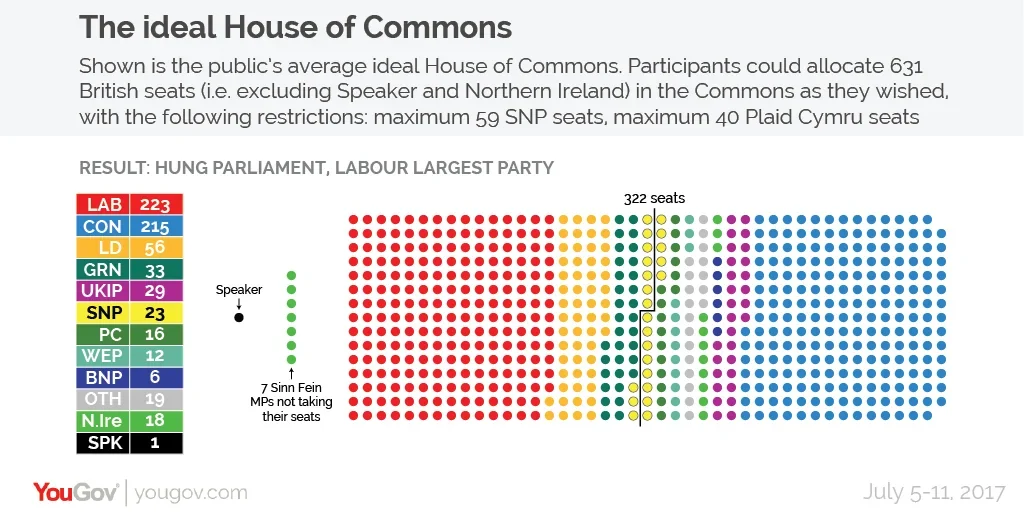
The Liberal Democrats would reclaim their status as the Commons’ third party, attaining an average of 56 seats – about the same as they won at the 2010 election. The SNP fall back to an average of 29 seats from the 35 they won in 2017.
Britons’ average ideal House of Commons would also provide a breakout moment for many minor parties. The Greens would find themselves on an average of 33 seats and UKIP on an average of 29 seats - far higher than either party has achieved to date. The Women’s Equality Party and the BNP would gain representation in the Commons for the first time ever, on an average of 12 seats and 6 seats respectively.
While the public's average ideal House of Commons is obviously a hung parliament, it is worth pointing out that when examined on an individual level the data shows that in fact 70% of the public's scenarios resulted in a majority government and only 30% a hung parliament.
Conservative and Labour voters’ ideal House of Commons
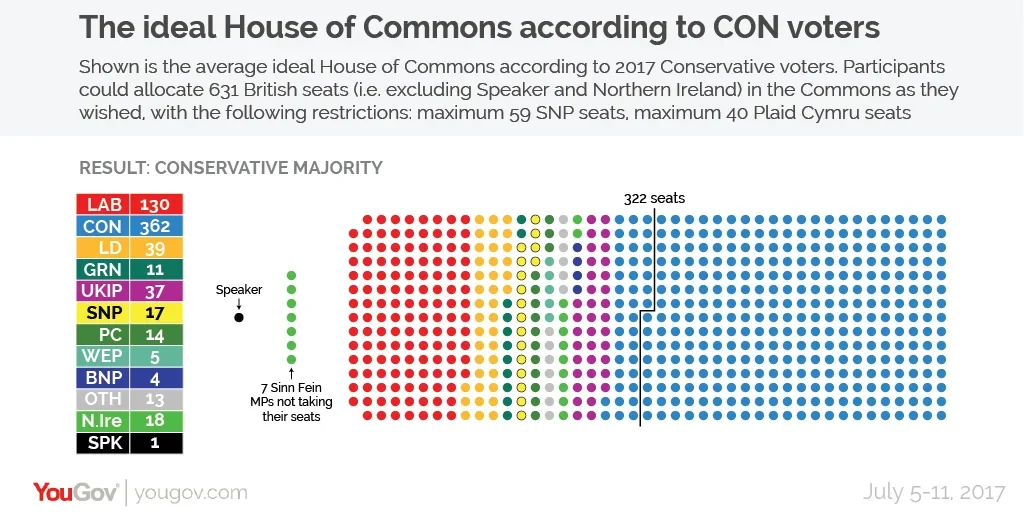
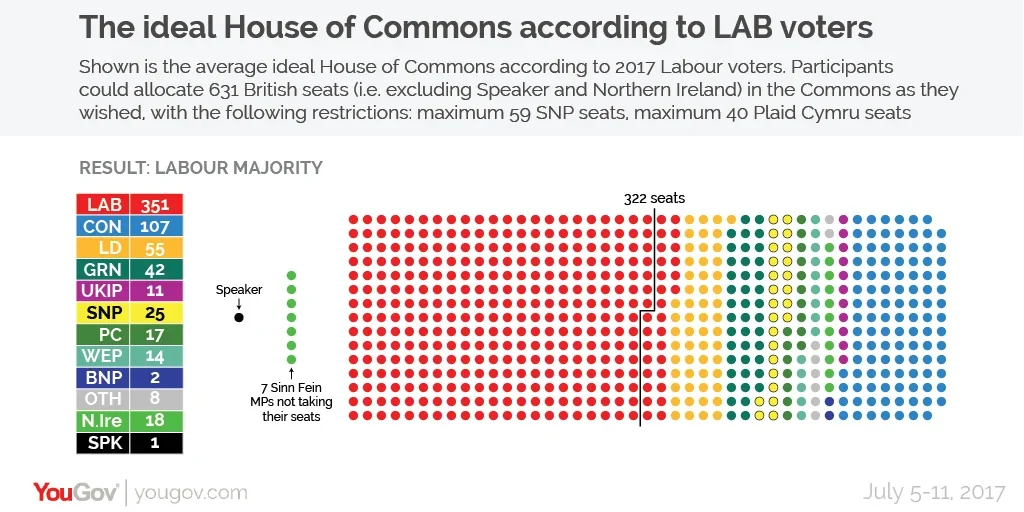
When taken as an average, neither Labour nor Conservative voters assigned their preferred parties especially massive majorities. Conservative voters gave the Tories 362 seats on average (a majority of 82). This is not as large as the 144 seat majority achieved by Margaret Thatcher in her 1983 landslide. Meanwhile Labour voters, on average, assigned their party 351 seats (a majority of 60), compared to the 179 seat majority secured by Tony Blair in 1997.
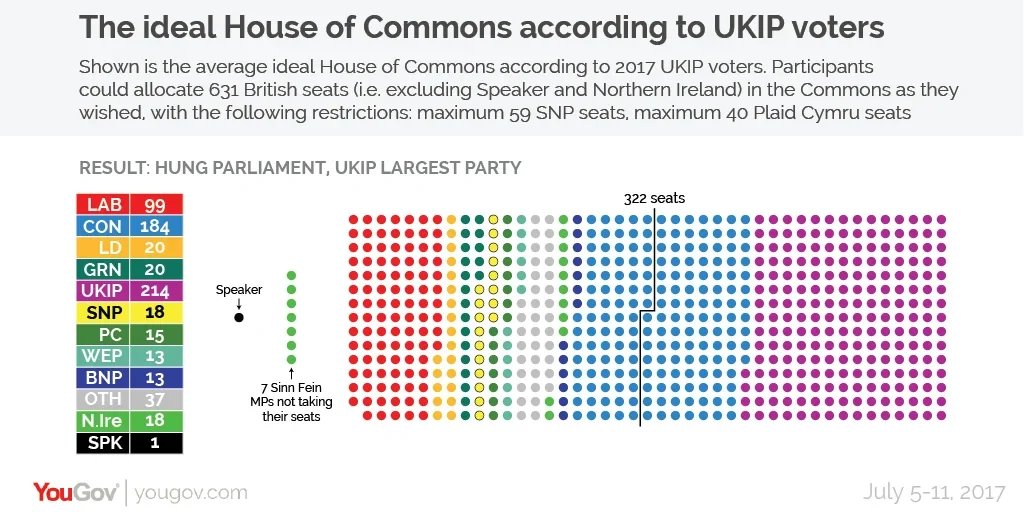
UKIP voters’ ideal House of Commons
UKIP voters would, on average, assign the party 214 seats, making it the largest in the Commons ahead of the Conservatives on 184 and Labour on 99. UKIP voters gave the BNP its highest number of seats, assigning the party 13 seats on average.
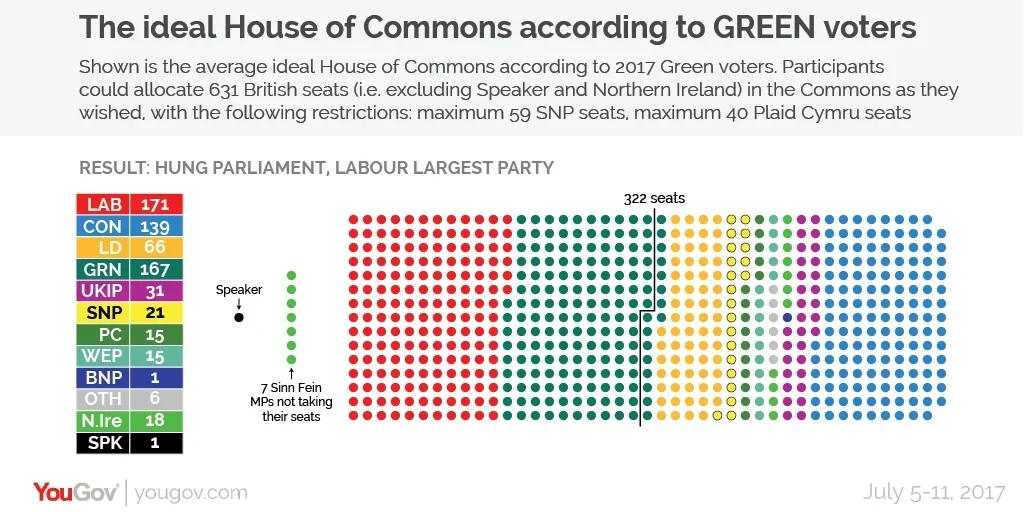
Green voters’ ideal House of Commons
Among Green voters the party would be almost tied for the largest in parliament, with their average of 167 seats only marginally behind Labour’s 171. It is among Green voters that the Women’s Equality Party performs best with the party gaining an average of 15 seats.
Lib Dems voters’ ideal House of Commons
Lib Dem voters do not, on the whole, want to see the Liberal Democrats as the largest party in the Commons. The average number of seats Lib Dem voters want their party to have is 159 – quite far behind the average 201 seats they would give to Labour and only marginally ahead of the average 150 they would assign to the Conservatives.
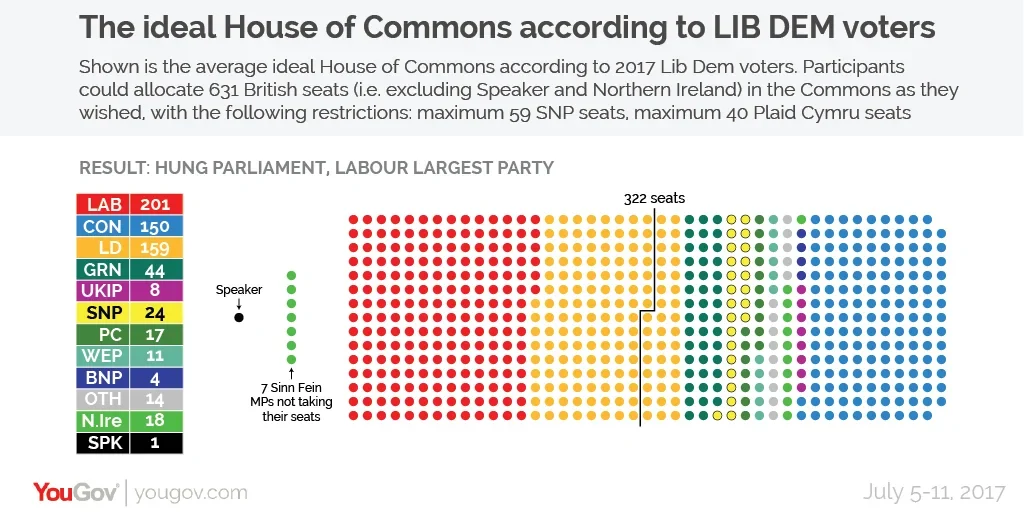
Photo: iStockphoto