

One of Britain's biggest ever post-election surveys reveals where votes shifted between 2015 and 2017
In the immediate aftermath of the general election we released our social demographic data on how Britain voted at the 2017 election. Using data from more than 50,000 people, it covered factors like age, class, gender and education. Now, using this same dataset, YouGov shows how the votes of those who cast a ballot at the 2015 general election shifted at this year's vote.
Please note, this piece is focussed only on the 2017 voting behaviour of Britons who voted in 2015 – it does not go into detail on those who did not or could not vote in the 2015 general election. It is based on the vote in Great Britain and does not include shares for Northern Ireland.
The two main parties held on to most of their own 2015 voters, while gobbling up everyone else’s
Both Labour and the Conservatives held on to 71% of their 2015 voters. Similar proportions of the main two parties’ 2015 electorate (9% for the Conservatives, 8% for Labour) switched their vote to the opposing party – although given that the 2015 Conservative electorate was larger than Labour’s this means that the Tories actually lost more voters to Labour than they gained from them.
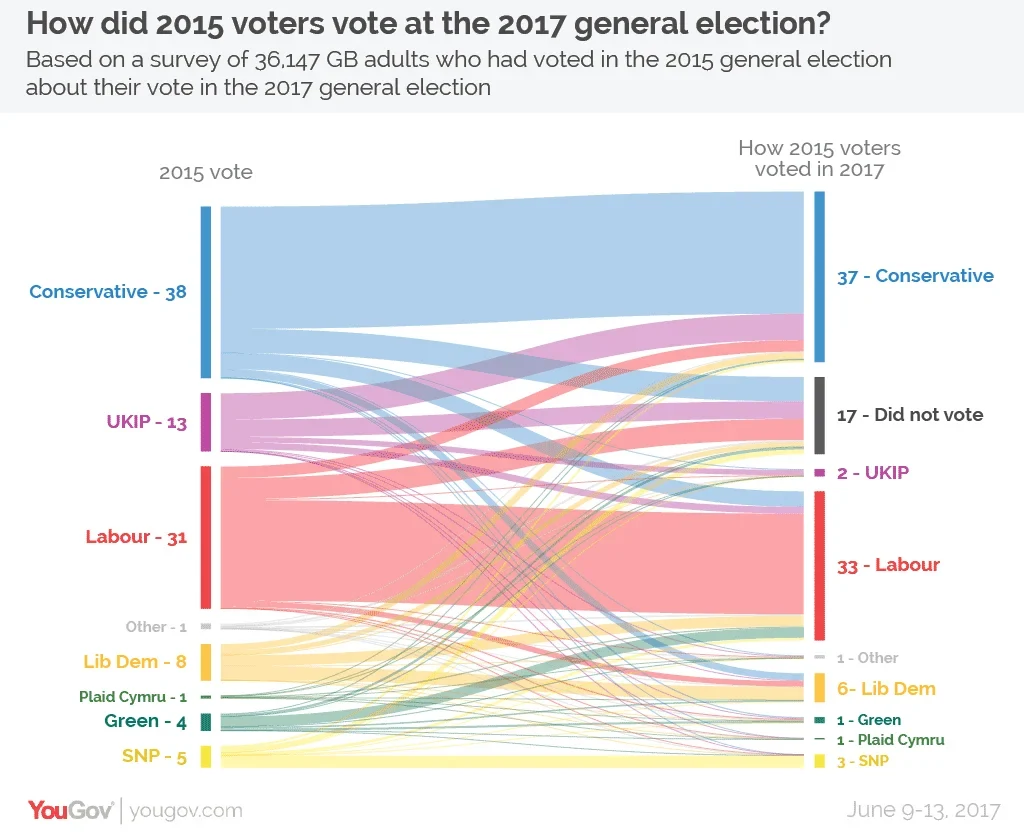
Much has been made already of the fact that the combined vote share of the two main parties is higher than it has been since the 1970s. Our data clearly highlights how successful the Conservatives and Labour were in syphoning off voters that backed other parties in 2015.
Labour managed to bring on board almost six in ten (59%) 2015 Green voters and over four in ten (43%) of Plaid Cymru supporters from the last election. The Conservatives, for their part, were the primary beneficiaries of the collapse in the UKIP vote – 45% of 2015 UKIP voters went over to the Tories, while just 11% of it went to Labour.
The Liberal Democrats only held on to 36% of their 2015 voters. Approaching three in ten (29%) went to Labour, and more than one in six (18%) switched to the Conservatives.
The SNP managed to hold on to just 55% of their voters from the last election, losing 22% of their 2015 voters to the pro-union parties and most of the rest to apathy (see below).
The SNP and UKIP also suffered from lower turnout rates
The decline in the UKIP and SNP vote at the 2017 general election is also partly down to the parties’ failure to get their previous voters to the ballot box. Three in ten (30%) 2015 UKIP supporters didn't vote this year, as did almost a quarter (23%) of the SNP’s backers from two years ago.
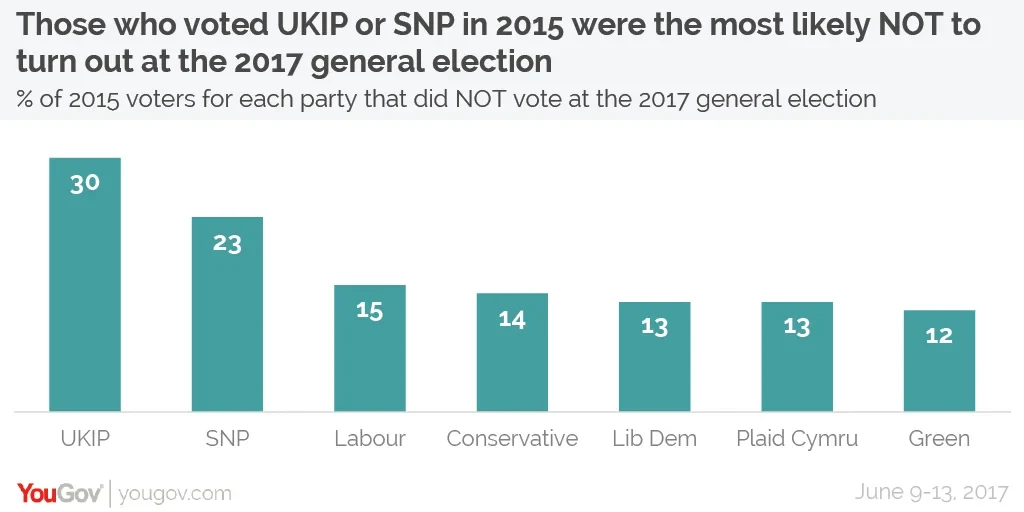
By contrast, the other main parties only saw 12%-15% of their 2015 voters fail to turn out (although it should be noted that Labour Leave voters were also noticeably less likely to turn out, at 21%).
Brexit realignment
During this year's campaign, much was made of the likelihood that the 2017 general election would see a realignment of the electorate along the Brexit dividing lines. The results show that this has been the case – but not necessarily to the extent that people had anticipated.
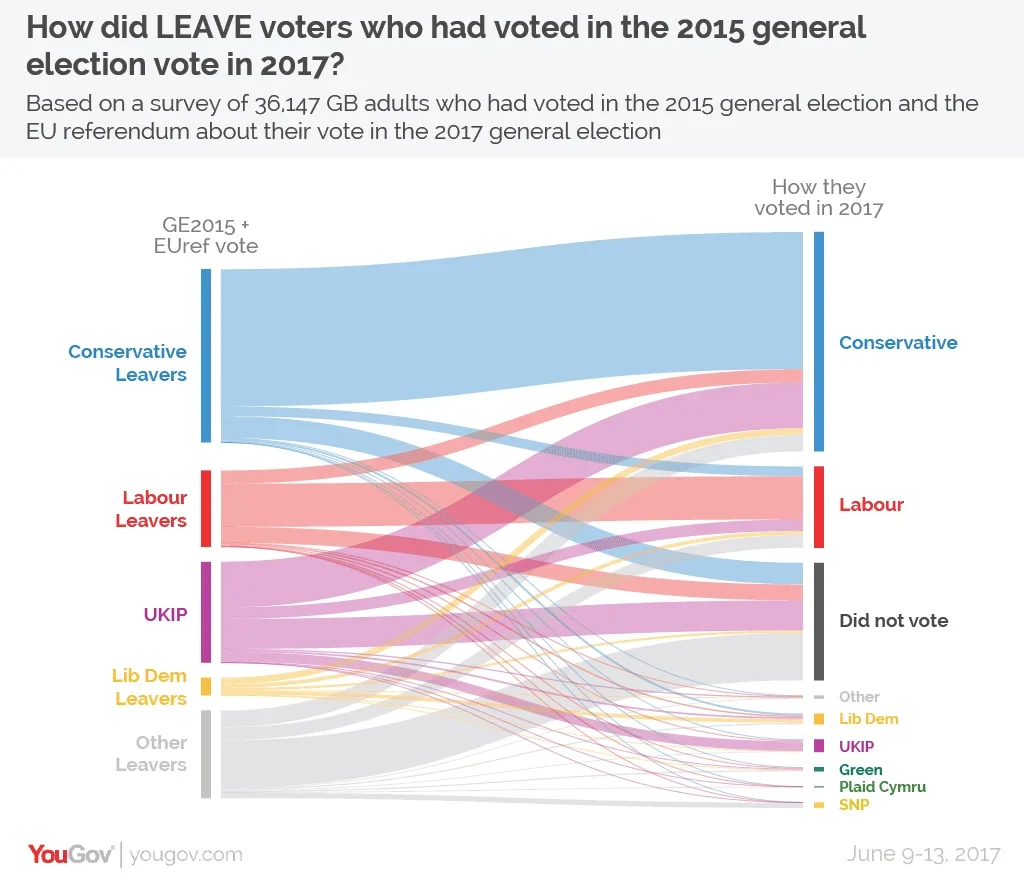
The Conservatives lost a chunk of their Remain voters to both Labour (15%) and the Liberal Democrats (9%). Similarly, Labour lost one in six (17%) of their Leave voters to the Conservatives.
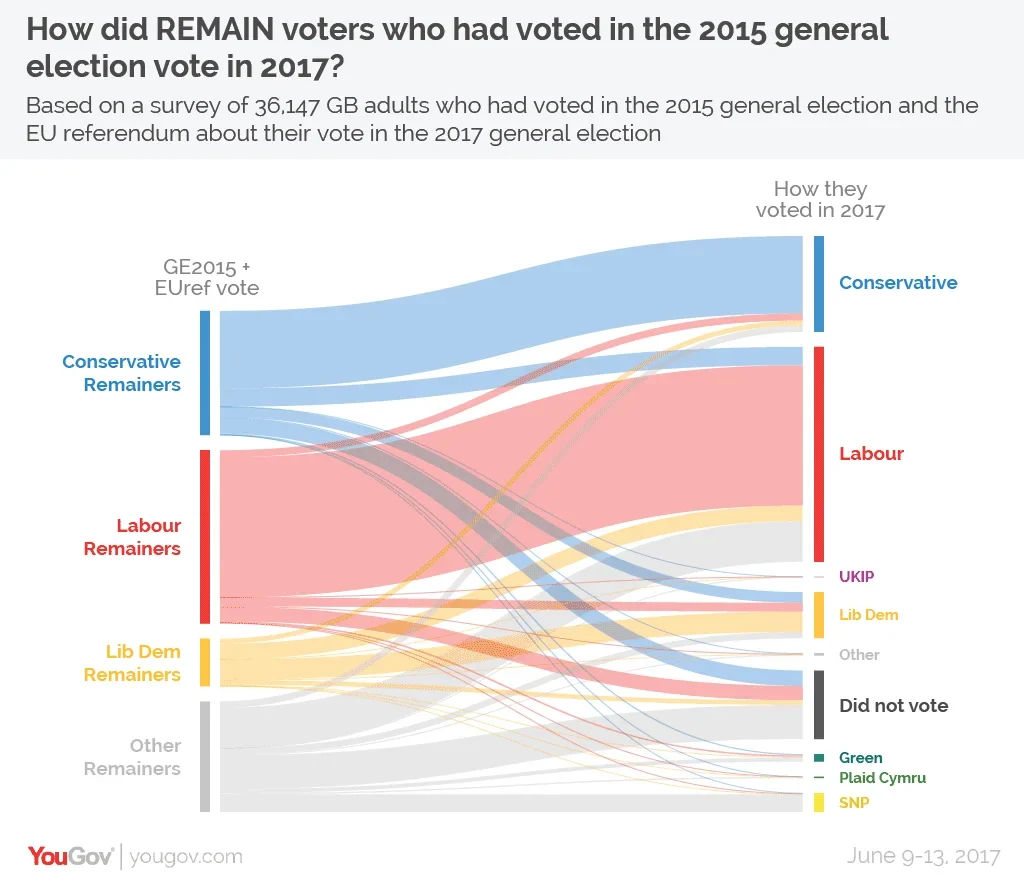
While many (45%) of UKIP’s 2015 voters shifted to the Conservatives, the picture among Lib Dems was somewhat more mixed. A third (33%) of Lib Dem Remainers went to Labour, while a further 10% moved to the Conservatives. For Lib Dem Leavers, these figures were 21% and 37% respectively.
This Brexit realignment didn't have an enormous impact on the way the main parties’ voter base was composed in terms of Remain/Leave, mostly because they were quite skewed toward one side or the other to begin with.
The 2017 Conservative vote was composed of 71% Leave voters and 29% Remain voters (this and all following figures exclude those who did not vote at the EU referendum). Their 2015 vote was split 61%/39% respectively.
Labour’s Remain/Leave composition shifted far less. Their 2017 vote was made up of 71% Remain voters and 29% Leave voters, from 67% and 33% respectively in 2015.
As for the Liberal Democrats, their electoral makeup shifted from 71% Remain/29% Leave in 2015 to 80% Remain/20% Leave this year.
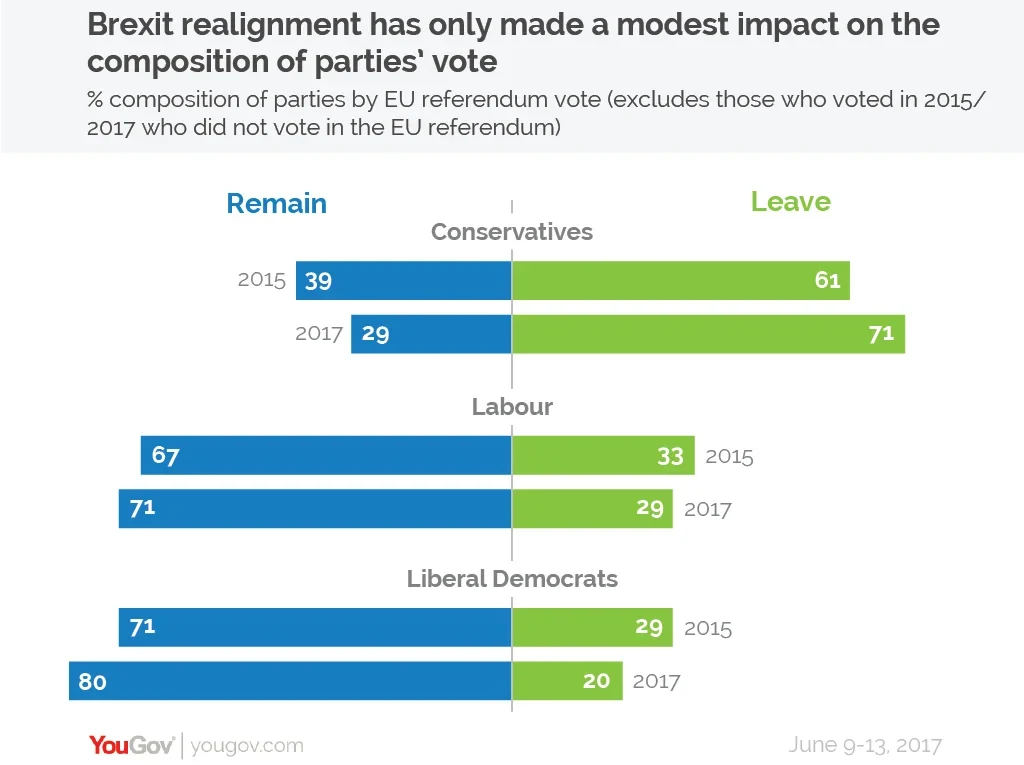
Photo: PA