
As the campaign starts, YouGov data shows how class, age, gender, education and income will shape the electorate
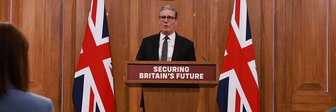
In announcing the snap election, Theresa May set out her desire to create a “more united” country in the aftermath of last year’s referendum. But as the campaign begins, new YouGov analysis of over 12,000 people shows the demographic dividing lines of British voters.
Although every voter is an individual, this data shows how demographics relate to electoral behaviour. These divides will shape the next few weeks – from the seats the parties target to the key messages they use. Over the course of the campaign we will not just be monitoring the “headline” voting intention numbers, but also the many different types of voters that make up the electorate.
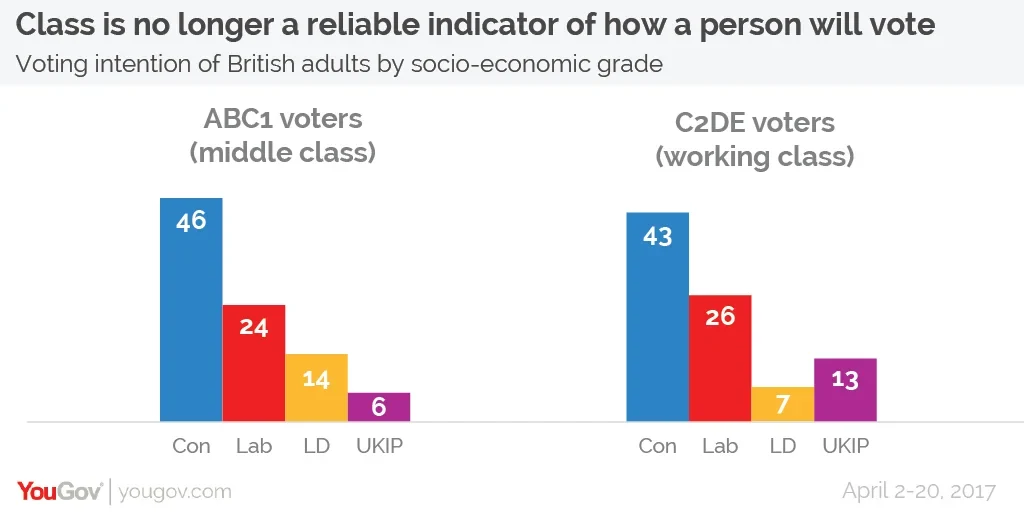
Class: No longer a good predictor of voting behaviour
“Class” used to be central to understanding British politics. The Conservatives, to all intents and purposes, were the party of the middle class and Labour that of the workers. The dividing lines were so notable that you could predict, with a reasonable degree of accuracy, how someone would vote just by knowing their social grade. For example at the 1992 election the Conservatives lead Labour amongst ABC1 (middle class) voters by around 30 points, whilst Labour was leading amongst C2DE (working class) voters by around 10 percentage points.
But today, class would tell you little more about a person’s voting intention that looking at their horoscope or reading their palms. As this campaign starts, the Conservatives hold a 22% lead amongst middle class voters and a 17% lead amongst working class ones.
Age: The new dividing line in British politics
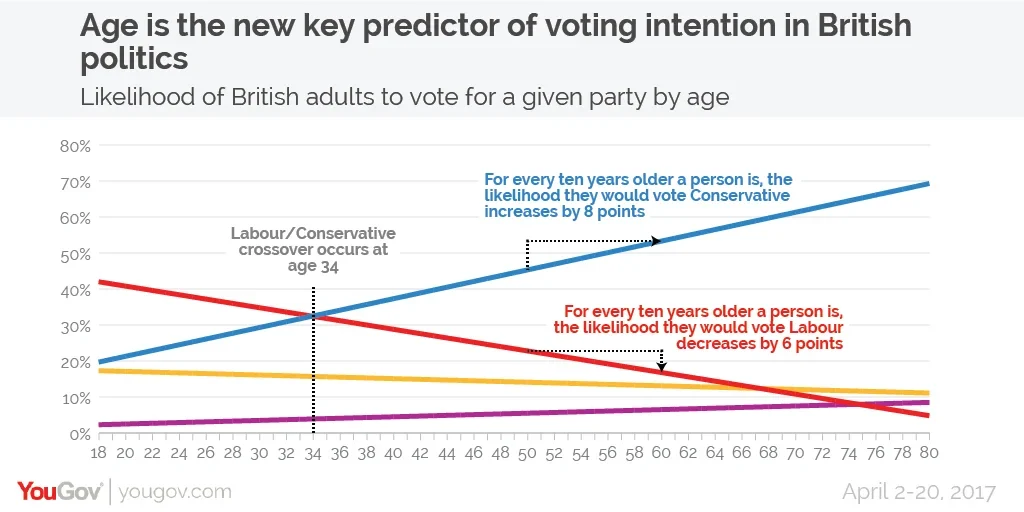
In electoral terms, age is the new class. The starkest way to show this is to note that Labour is 19% ahead when it comes to 18-24 year-olds and the Conservatives are ahead by 49% among the over 65s. Our analysis suggest that the current tipping point – which is to say the age where voters are more likely to favour the Conservatives over Labour – is 34.
In fact, for every 10 years older a voter is, their chance of voting Tory increases by around 8% and the chance of them voting Labour decreases by 6%. This age divide could create further problems for Labour on 8 June. Age is also a big driver of turnout, with older people being far more likely to vote than young people. It’s currently too early to tell the exact impact this could have on the final result.
Gender: The Conservative’s non-existent “women problem”
Before the last election David Cameron was sometimes described as having a “woman problem”. Our research at the time showed this narrative wasn’t quite accurate as while it was true that they were doing slightly better amongst young men than young women, they were also doing slightly better among older women than older men.
However, these two things cancelled each other out meaning that ultimately the Conservatives polled about the same amongst both men and women. Going into the 2017 election women are, if anything, slightly more (three percentage points) likely overall to vote Tory.
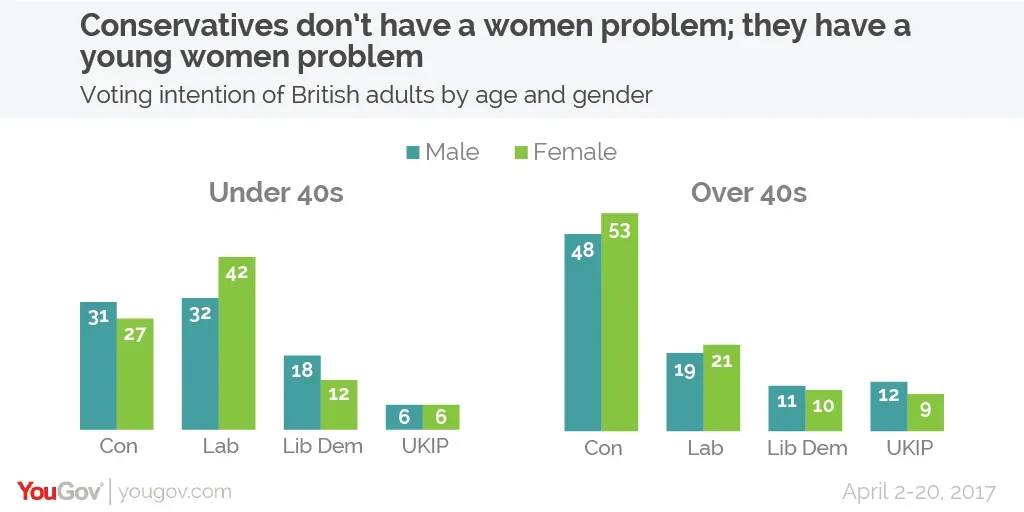
Labour has a large gender gap among younger voters. The party receives 42% of the under-40 women’s vote compared to just 32% amongst men of the same age – a gap of nine points. However among older voters this almost disappears completely. When you just look at the over-40s, the gap is just two points – with 21% of women and 19% of men of that age saying they will vote Labour.
With both of the two main now parties performing better amongst women overall, it’s the other parties who are balancing this out by polling better amongst men. UKIP have the support of 2% more men than women, whilst the gender gap is 3% for the Lib Dems.
Education: The higher the qualification, the higher Labour’s vote share
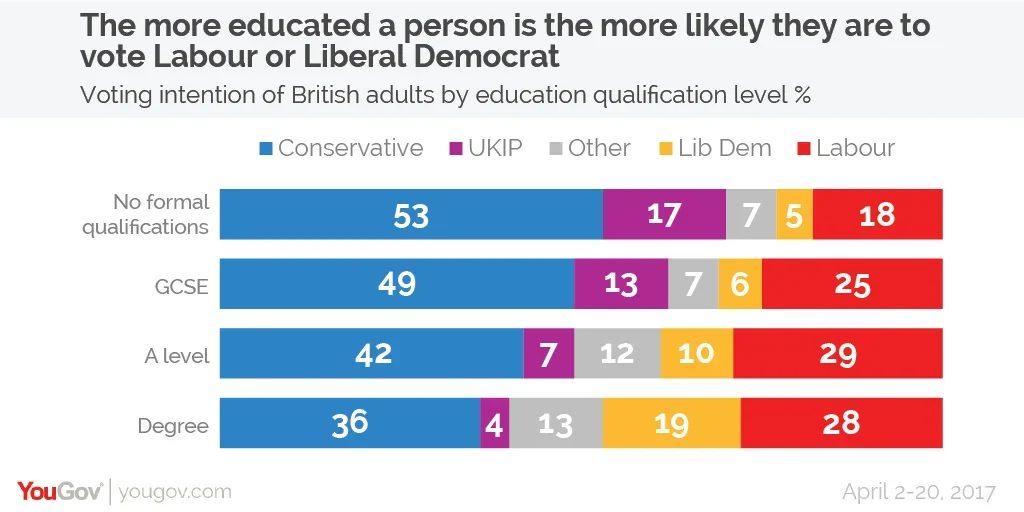
Alongside age, education has become one of the key electoral demographic dividing lines. We saw it was a huge factor in the EU referendum campaign and, after the last general election, we made sure we accounted for qualifications in our methodology. This election will be no different. While the Conservatives lead amongst all educational groupings, their vote share decrease for every extra qualification a voter has, whilst the Labour and Lib Dem vote share increases.
Amongst those with no formal qualifications, the Conservative lead by 35%. But when it comes to those with a degree, the Tory lead falls to 8%. Education also shapes other parties’ vote shares. UKIP also struggles amongst highly educated voters, polling four times higher amongst those with no formal qualifications compared to those with a degree.
Income: Labour’s tax increase won’t affect many Labour voters
John McDonnell, Labour’s Shadow Chancellor, has already made income part of this campaign by labelling those who earn above £70,000 a year as “rich” and hinting they may face tax rises. One of the reasons for the policy might be that the party has very few votes to lose amongst those in this tax bracket.
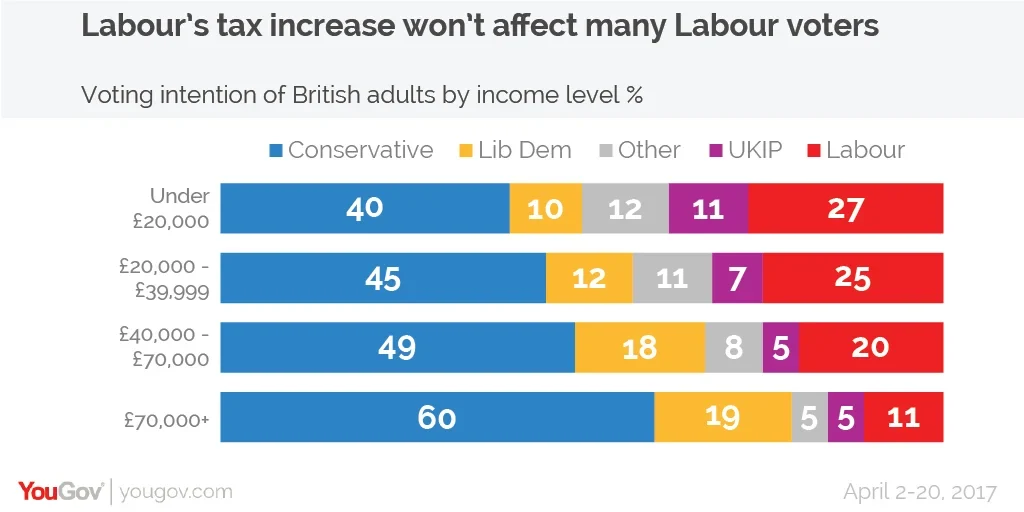
Amongst those earning over £70,000 a year, Labour is in third place with just 11% support. The Conservatives pick up 60% of this group’s support and the Lib Dems also perform well, getting almost a fifth (19%) of their votes.
But while the Conservatives are still the party of the rich, Labour is no longer the party of the poor. They are 13% behind amongst those with a personal income of under £20,000 a year, although it is worth noting that this group will also include many retired people who will be poor in terms of income but rich in terms of assets.
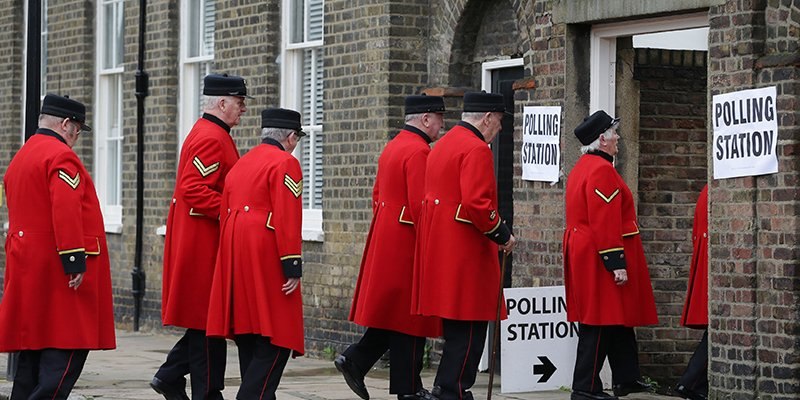
Photo: PA