
An introduction to our full investigation into what went wrong with YouGov's 2015 general election polling
All the pre-election polls in the 2015 general election were wrong, significantly overestimating Labour support and underestimating Conservative support. We have conducted extensive research on YouGov data for that election and have identified the source of most of the error and how to correct it in the future. Other pollsters using other methodologies (eg offline) produced the same degree of error and we think what we have uncovered probably applies to them as well, although of course we cannot be sure.
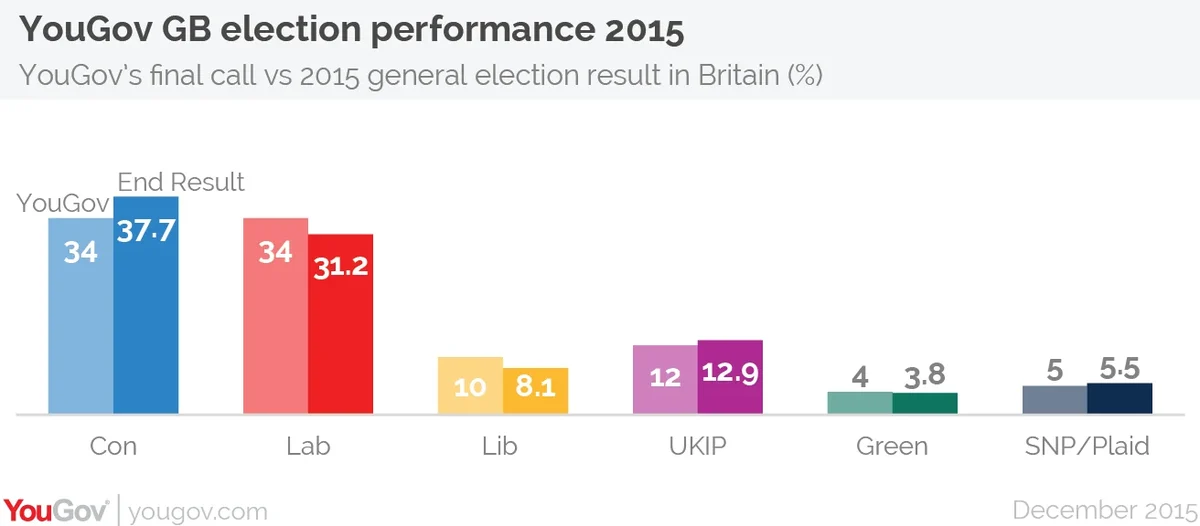
Note: Our final poll had Labour and the Conservatives tied at 34% when in fact the Conservatives won with 37.7% of the vote, well ahead of Labour at 31.2% of the vote. This 3.7% understatement of the Conservative vote and 2.8% overstatement of the Labour vote makes an average error of 3.35% (which translates into a 6.7% error in estimating the lead). The other parties were essentially correct. For consistency and clarity, throughout this report we will use the 3.7% underestimate of the Conservative vote as the number we have to account for. When we talk of correcting 2.4% skew, for example, we are addressing two-thirds of the error.
We asked our Chief Scientist Doug Rivers, Professor at Stanford University, along with Anthony Wells, research director in our London-based politics team, to conduct a detailed investigation and to write a full report - we publish that report today. We conclude that the main causes of error are:
- The younger age range within the samples over-represent those who are more engaged in politics and are therefore more likely to vote. As younger people, they disproportionately supported Labour, so having too many young voters in our likely voter sample skewed the overall result towards Labour. We believe we had the party voting proportions for this age group correct but that fewer of them actually voted than our sample suggested. This can be corrected in the future in two ways: a) interviewing the correct proportion of people who are less interested in politics, and b) weighting the sample to the expected turnout for different demographic groups. The problem with both of these is that, unlike in the US where detailed exit poll data is publicly available, in the UK no detailed information is available by which we can know the correct target proportions for each age group. However, we can make better estimates of them.
- The oldest demographic group, the over-seventies, were under-represented in our samples. They voted disproportionately for the Conservatives, and having too few of them in our samples skewed it slightly against the Conservatives. This can be corrected in the future in two ways: a) interviewing the correct number of over-seventies, and b) weighting the over-seventies in our samples to the correct target weights. We do have objective information for the size of this demographic group.
- Combined, we calculate that these two factors related to age and political engagement make up 2.3% of the 3.7% total error.
- This leaves 1.4% unaccounted for. Our report notes some other minor skews, but it is hard to assess their combined effect. It is worth noting that a special computation (provided by Professors John Curtice and Stephen Fisher) shows the error in the exit poll estimate of Conservative vote in 2015 and in the swing in Conservative vote between 2010 and 2015 underestimated the Conservative vote by about 1.4%. This happened in six out of seven regions, which suggests that the effect is not due to the choice of polling stations within the regions. Nor should the method be open to sampling issues.
- One cannot discount misreporting ("shy Tories"), but we can find no direct evidence for it. In this election, polling showed dissonance between the outcome which people (in aggregate) said they wanted, and their underlying party preference. There was a strong overall preference for a Cameron-led government over an SNP-influenced government led by Labour leader Ed Miliband, although stated voting preferences would not have delivered that. It is possible that this led to some respondent misreporting, if people wanted to express their party preference and not their actual tactical vote, but it is impossible to establish this objectively as we can never know how individual respondents really voted.
What YouGov will do to correct these errors
YouGov's panel methodology allows YouGov to correct for age and levels of political interest. We draw our samples from a panel of over 400,000 respondents about whom we already know a huge amount - including of course age and other standard demographics, but also media consumption and levels of political interest. In the future we will be able to draw from our panel the right number of each target group. We will also boost the panel for more of these hard to reach groups with additional specialised recruitment techniques.
We will also place increased emphasis on testing for dissonance between likely drivers of behaviour and reported intentions. This will be highly relevant to the euro referendum: we will need to cope with people's desire to express their Euro-scepticism, which today is very widespread, but (history suggests) may be counter-pulled by powerful risk aversion. We will in future provide additional data on our tests for dissonance.
Actions right now:
1. We have begun increasing the number of non politically engaged people on the panel
2. We are concluding our investigation into how best to include measurements of political engagement in our sampling and weighting for political polls
3. We are adjusting our sampling targets to better reflect the age profile of Britain, ensuring that we include more of the older age groups
4. As ever, all changes will be thoroughly tested before being rolled out in our published opinion polling, which is currently weighted to the outcome of the 2015 general election
PA image