YouGov Profiles data reveals the most and least popular of 47 English counties
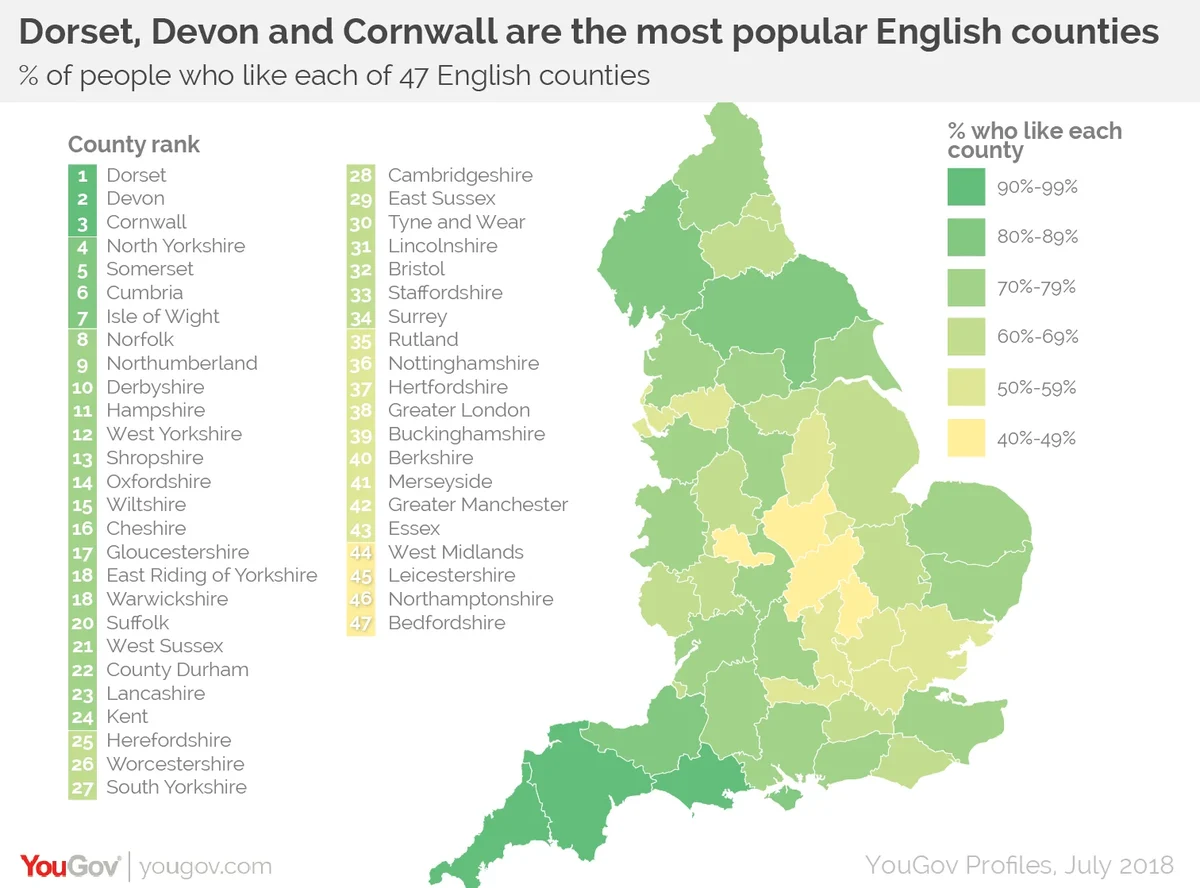
Newly released YouGov Profiles data on the opinions of more than 42,000 people towards 47 English counties reveals that Dorset and Devon top the popularity charts, with 92% saying that they like each of the counties.
The South West is actually home to four of the top five most liked counties – Cornwall places 3rd at 91% and Somerset 5th at 86%. The only county outside the South West to make the top five list is North Yorkshire, in 4th place at 87%.
Only two other counties had a like rate of 80% or higher – Cumbria (85%) and the Isle of Wight (80%).
At the bottom of the table, Bedfordshire is the least liked county, with only 40% saying they like it. In a more distant second-from-last comes Northamptonshire on 47%, with Leicestershire third from bottom at 48%.
Photo: Getty
The full list of rankings can be found below
| County | % who like the county | Rank |
|---|---|---|
Dorset | 92% | 1 |
Devon | 92% | 2 |
Cornwall | 91% | 3 |
North Yorkshire | 87% | 4 |
Somerset | 86% | 5 |
Cumbria | 85% | 6 |
Isle of Wight | 80% | 7 |
Norfolk | 79% | 8 |
Northumberland | 79% | 9 |
Derbyshire | 77% | 10 |
Hampshire | 75% | 11 |
West Yorkshire | 75% | 12 |
Shropshire | 74% | 13 |
Oxfordshire | 73% | 14 |
Wiltshire | 73% | 15 |
Cheshire | 72% | 16 |
Gloucestershire | 72% | 17 |
East Riding of Yorkshire | 71% | 18 |
Warwickshire | 71% | 18 |
Suffolk | 71% | 20 |
West Sussex | 71% | 21 |
County Durham | 70% | 22 |
Lancashire | 70% | 23 |
Kent | 70% | 24 |
Herefordshire | 69% | 25 |
Worcestershire | 68% | 26 |
South Yorkshire | 66% | 27 |
Cambridgeshire | 66% | 28 |
East Sussex | 65% | 29 |
Tyne and Wear | 64% | 30 |
Lincolnshire | 64% | 31 |
Bristol | 63% | 32 |
Staffordshire | 62% | 33 |
Surrey | 62% | 34 |
Rutland | 59% | 35 |
Nottinghamshire | 59% | 36 |
Hertfordshire | 59% | 37 |
Greater London | 58% | 38 |
Buckinghamshire | 57% | 39 |
Berkshire | 55% | 40 |
Merseyside | 55% | 41 |
Greater Manchester | 53% | 42 |
Essex | 50% | 43 |
West Midlands | 49% | 44 |
Leicestershire | 48% | 45 |
Northamptonshire | 47% | 46 |
Bedfordshire | 40% | 47 |


