
Over-65s were more than twice as likely as under-25s to have voted to Leave the European Union
We have now weighted our final poll to match the headline result, and the detail within it gives the best possible indication of how Britain actually voted last Thursday.
The vote to Leave exposed significant divisions within the country, as every region of the country except Scotland, Northern Ireland and London voted to Leave. Geography is not the only fissure in the country. Voters differed significantly according to age and education.
The most dramatic split is along the lines of education. 70% of voters whose educational attainment is only GCSE or lower voted to Leave, while 68% of voters with a university degree voted to Remain in the EU. Those with A levels and no degree were evenly split, 50% to 50%.
Age is the other great fault line. Under-25s were more than twice as likely to vote Remain (71%) than Leave (29%). Among over-65s the picture is almost the exact opposite, as 64% of over-65s voted to Leave while only 36% voted to Remain. Among the other age groups, voters aged 24 to 49 narrowly opted for Remain (54%) over leave (46%) while 60% of voters between the ages of 50 and 64 went for Leave.
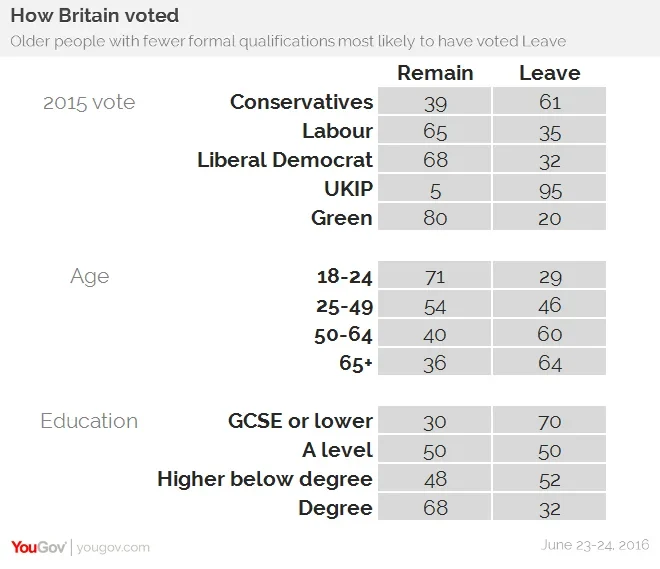
The vote on Britain's membership of the European Union cut across party lines, with significant division within Britain's main political parties. Conservatives voted to Leave, 61% to 39%. Labour voters (65%) and Liberal Democrats (68%) largely voted for Remain but significant minorities went for Leave. Only UKIP, where 95% voted for Leave, and the Greens, where 80% voted for Remain, avoided significant internal divisions on the vote.
Image: Press Association