
The areas the public would like to cut or protect don’t always line up with government plans
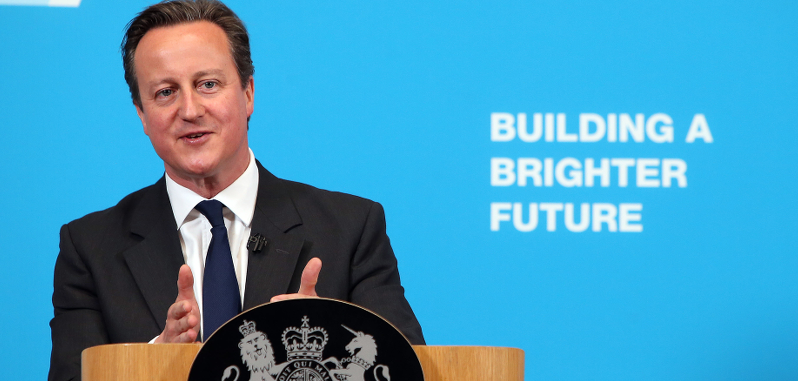
This week David Cameron began to sketch out the government’s £12 billion in additional cuts to welfare benefits with a speech in Runcorn. The cuts were part of the Tory platform to eliminate the deficit set out ahead of the election but have yet to be fully explained. Ministers have ruled out cuts to child benefit and pensioner benefits, leaving some question where the £12 billion will come from.
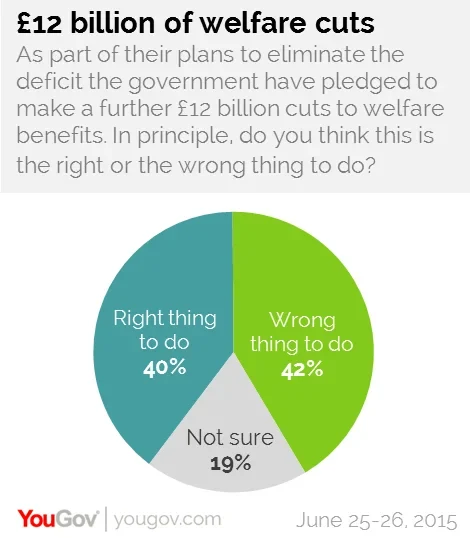
New YouGov research finds that in principle the £12 billion in cutbacks divide the public in two. 40% say the government is in the right, while 42% say they are in the wrong and 19% are unsure.
Looking at individual areas to cut, there is in some areas wider agreement.
A 59% majority of the public back old age benefits like the winter fuel payment and free bus passes. The same number (58%) think child benefit should not be protected despite the government’s determination to do so.
Similarly, 55% back restricting the number of people who get out-of-work benefits like jobseekers allowance, something the government has proposed.
However there are two other areas where changes are expected people are more evenly split. 43% favour stopping the housing benefit for under-25s, while 39% are against it. 41% want to restrict benefits for low-paid working people like the working tax credit and the child tax credit. 47% want these benefits protected.
In his speech Cameron said his aim is to stop the welfare “merry-go-round” with low wage working people paying into the system through taxes only to be given the money back in benefits. More detailed plans are expected ahead of next month’s Budget.
The prime minister appears to be benefiting from something of a post-election honeymoon in public opinion nearly two months after winning a majority. Half the public continue to approve of how he is doing his job, identical to mid-May. This includes 90% of those who voted Conservative at the latest election, as well as 58% of Lib Dem voters, 47% of Ukip backers and 13% of Labour supporters.
PA image