

Dr Joel Faulkner Rogers discusses the effects of question-wording on research
A key focus for YouGov research is on the effects of question-wording itself.
This goes beyond screening for loaded terms and leading questions. From boo-words and agreement bias to warm-ups, cold starts and response-order influence, it aims to explore interactions between language and psychology, and how the wording and context of questions can shape and shed varying angles of light on responses and survey-behaviour.
The technology of survey experiments has transformed over the last decade, but this kind of research isn’t new. Among the earliest examples appeared during the Second World War in the United States, when two sets of respondents were asked different versions of a comparable question about free speech.
One sample was asked, “Do you think the United States should forbid public speeches against democracy?”, with answer-options including: [1] Yes, should forbid; [2] No, should not forbid; and [3] Don’t know.
The other sample was asked: “Do you think the United States should allow public speeches against democracy”, with answer-options including: [1] Yes, should allow; [2] No, should not allow; and [3] Don’t know.
With all other things being equal, some might expect the percentage of those choosing “forbid” in one sample to equal roughly those choosing “not allow” in the other. On the contrary, 54% in the first survey said the United States should “forbid” public speeches against democracy, with 46% saying it should “not forbid” them. By comparison in the second survey, a significantly larger 75% said the United States should “not allow” public speeches against democracy, versus 25% saying it should “allow” them.
Hence, the difference of a single word in the context of attitudes to free speech had a substantial impact on results, with some 20% more respondents willing to “not allow” a certain kind of speech than to “forbid” it.
Research in the 1970s helped understanding of how certain question-types can have varying demographic effects. For instance, two national samples were asked similar questions about men and women in politics. One sample gave respondents an agree/disagree version asking: “Do you agree or disagree with the following statement: “Most men are better suited emotionally for politics than are most women”. The other sample received a forced-choice question asking, “Would you say most men are better suited emotionally for politics than are most women, or that men and women are equally suited, or that women are better suited than men in this area?”.
Results informed a growing body of research on the problem of agreement or acquiescence-bias, meaning the innate tendency of some respondents to agree with offered statements: 47% of respondents said men were better suited in the agree/disagree question, with 53% who disagreed. In the forced-choice version, meanwhile, only 33% said men were better suited compared with 66.9% overall who said men and women were equally suited or that women were better suited.
Perhaps more interesting was what the study showed about possible links between acquiescence-bias and education. There was no clear link between years of schooling and attitudes to female politicians in the forced-choice question. But answers to the agree/disagree version showed an increased tendency among those with fewer years of schooling to agree with the offered statement that men are “better suited”.
The context around questions can be similarly powerful. Studies from the 1980s helped to show the potential effect of giving cues to memory when asking respondents to recall their experience of victimisation, with the number of reported incidents increasing by 65% among those who were asked if they had experienced certain types of incident, such as “grabbing, punching, choking, scratching and biting”, rather than merely “assaults” in general.
Back to the modern age of polling, an early YouGov study in 2011 helped to demonstrate another key aspect of question-context in showing the difference between ‘warm’ and ‘cold’ testing of British attitudes to the BBC license fee. In this study, we posed the same inquiry – of whether respondents saw the license fee as good or bad value – in nine different ways to nine respective samples of the adult British population.
One of these samples was asked: “The cost of the BBC licence works out at £12.13 a month. Do think this is good or bad value for money?”, to which 37% answered “good” and 44% answered “bad”. For another of the nine samples, we first asked a warm-up question about how satisfied or dissatisfied respondents were with BBC services, including TV, radio channels and iPlayer, to which roughly three quarters of respondents said they were satisfied. Finally we asked the same question about the value of the licence fee, except this time 42% answered “good” versus 32% who answered “bad”, reflecting a shift in net score (of good minus bad) from a negative -7 to a positive +10.
This study also helped to emphasise something else, namely that the kind of online polling methods used by YouGov have given a quantum increase to the potential for population-based survey experiments, providing levels of comparability and control, along with a speed and quality of sampling techniques that earlier methodologists never imagined.
In our latest research of this kind, YouGov conducted a split-sample experiment in support of the Masters Degree Programme in Environmental Policy at Cambridge University.
The aim of this experiment was to test support for the idea of paying more on energy bills to help the environment, and to what extent this support is affected when respondents are asked to think in annual, monthly or weekly timescales.
We split a nationally representative sample of British adults three ways and asked a pair of questions in each case. For the first question, respondents were asked to write how much extra they would be willing to pay, if anything, on their energy bills, if the money were spent on reducing the environmental impact of energy production.
Accordingly, in Split-sample 1, we asked how much they would be willing to pay “per year”; in Split-sample 2 we asked the equivalent question “per month” and in Split-sample 3 we asked the equivalent question “per week”.
Answers to the first question showed that when respondents had to offer an amount themselves, little difference was made by asking them to think in annual, monthly or weekly terms. Per year, 24% said they would pay more compared with 43% who wouldn’t. Thinking per month, 26% said they would pay more compared with 41% who wouldn’t, and thinking per week, 25% said they would pay more compared with 44% who wouldn’t.
Incidentally for the curious: among those willing to pay extra in each case, the mean average amount of money that people said they would pay over a year was £161, while per month it was £12 and per week it was £9.
In the second question, however, respondents showed a clear sensitivity to the effects of thinking about different timescales and equivalent costs. This time respondents were asked to imagine an energy company had offered to introduce policies to reduce its environmental impact, and that this would cost a specific, additional amount of money to the average family’s energy bills.
In Split-sample 1, we inserted the figure of “£89 per year” as the “additional amount”, which was drawn from official estimates by the Department of Energy and Climate Change of added costs from government energy and climate change policies to the average UK household energy bill in 2011.
In Split-sample 2, we inserted the equivalent figure of “£7.40 per month”, and in Split-sample 3 the equivalent figure of “£1.70 per week”.
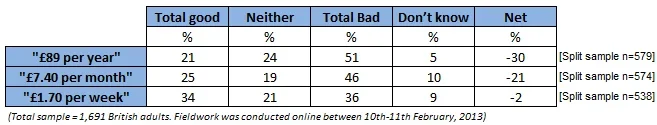
In each case, respondents were asked if they thought the respective figure was good or bad value for money. As results suggest below, people were increasingly likely to say the figure was good value as the equivalent timescale and unit of cost became smaller, with the net score (total “good” value minus total “bad”) falling from minus 30 to plus 2 between the largest and smallest equivalent figures, and the number of those choosing “good value” versus “bad value” rising from 21% versus 51% for “£89 per year” to a broadly divided 34% versus 36% for “£1.70 per week”.
“Imagine an energy company has offered to introduce policies that will reduce their impact on climate change, which would cost an additional [INSERTED FIGURE] to the average user family’s energy bills. Do you think this is good or bad value for money?”
Results further showed some intriguing demographic variance, with certain groups more sensitive to the wording change than others. Younger respondents, for example, appear more persuadable by the use of a smaller equivalent figure in this context than older respondents, with those aged 18-24 showing a much larger positive movement in net score support between “£89 per year” and “£1.70 per week” than the oldest age-group of those aged 60+ (respectively plus 8 to plus 43 for 18-24s, compared with minus 34 to minus 25 for +60s).
The political context also seemingly impacts sensitivity to wording changes. Using a smaller equivalent figure has greatest effect among Liberal Democrat supporters, whose party has traditionally the closest associations with environmental activism, showing a positive increase in net score of 35 between answers for “£89 per year” and “£1.70 per week”, compared with increases of 21 and 19 respectively for those supporting Labour and the Conservatives.
In late 2012, UK Energy Secretary Ed Davey presented his department’s longer-term policies for the UK energy sector to Parliament, including proposals to allow utility firms to increase the “green levy” between now and 2020.
Some critics have lambasted the plans arguing that they could increase the average, annual household energy bill by £100 per year.
The Energy Secretary has sought to counter this commentary in various ways. A different approach could be to scan a few highlights from the last six decades of experimentation on the psychology of question-wording and survey-behaviour, and then to remind voters that the true figure is more like £1.93 per week.