
YouGov asks the public where the borders lay, but their location remains a mystery for many
The term ‘Home Counties’ evokes images of a pleasant green landscape, village cricket matches and a quiet, prosperous existence. While most Brits know there’s an area of Southern England called the Home Counties, do they agree on which counties the term applies to?
In comparison to our survey on the West Country, the public opinion map of the Home Counties is characterised by uncertainty. While around seven in ten Brits could place a West Country county, the maximum for the Home Counties is just 55%. Between 36% and 40% of people did not know whether each of the most common candidates for Home County belonged to the group or not.
As it is, the counties most widely recognised as being Home Counties are Buckinghamshire (55%), Surrey (52%) and Berkshire (50%).
Somewhat less well recognised are Hertfordshire (44%) and Kent (42%), followed by Essex at 36%. These counties are all notable as being the six counties which border London.
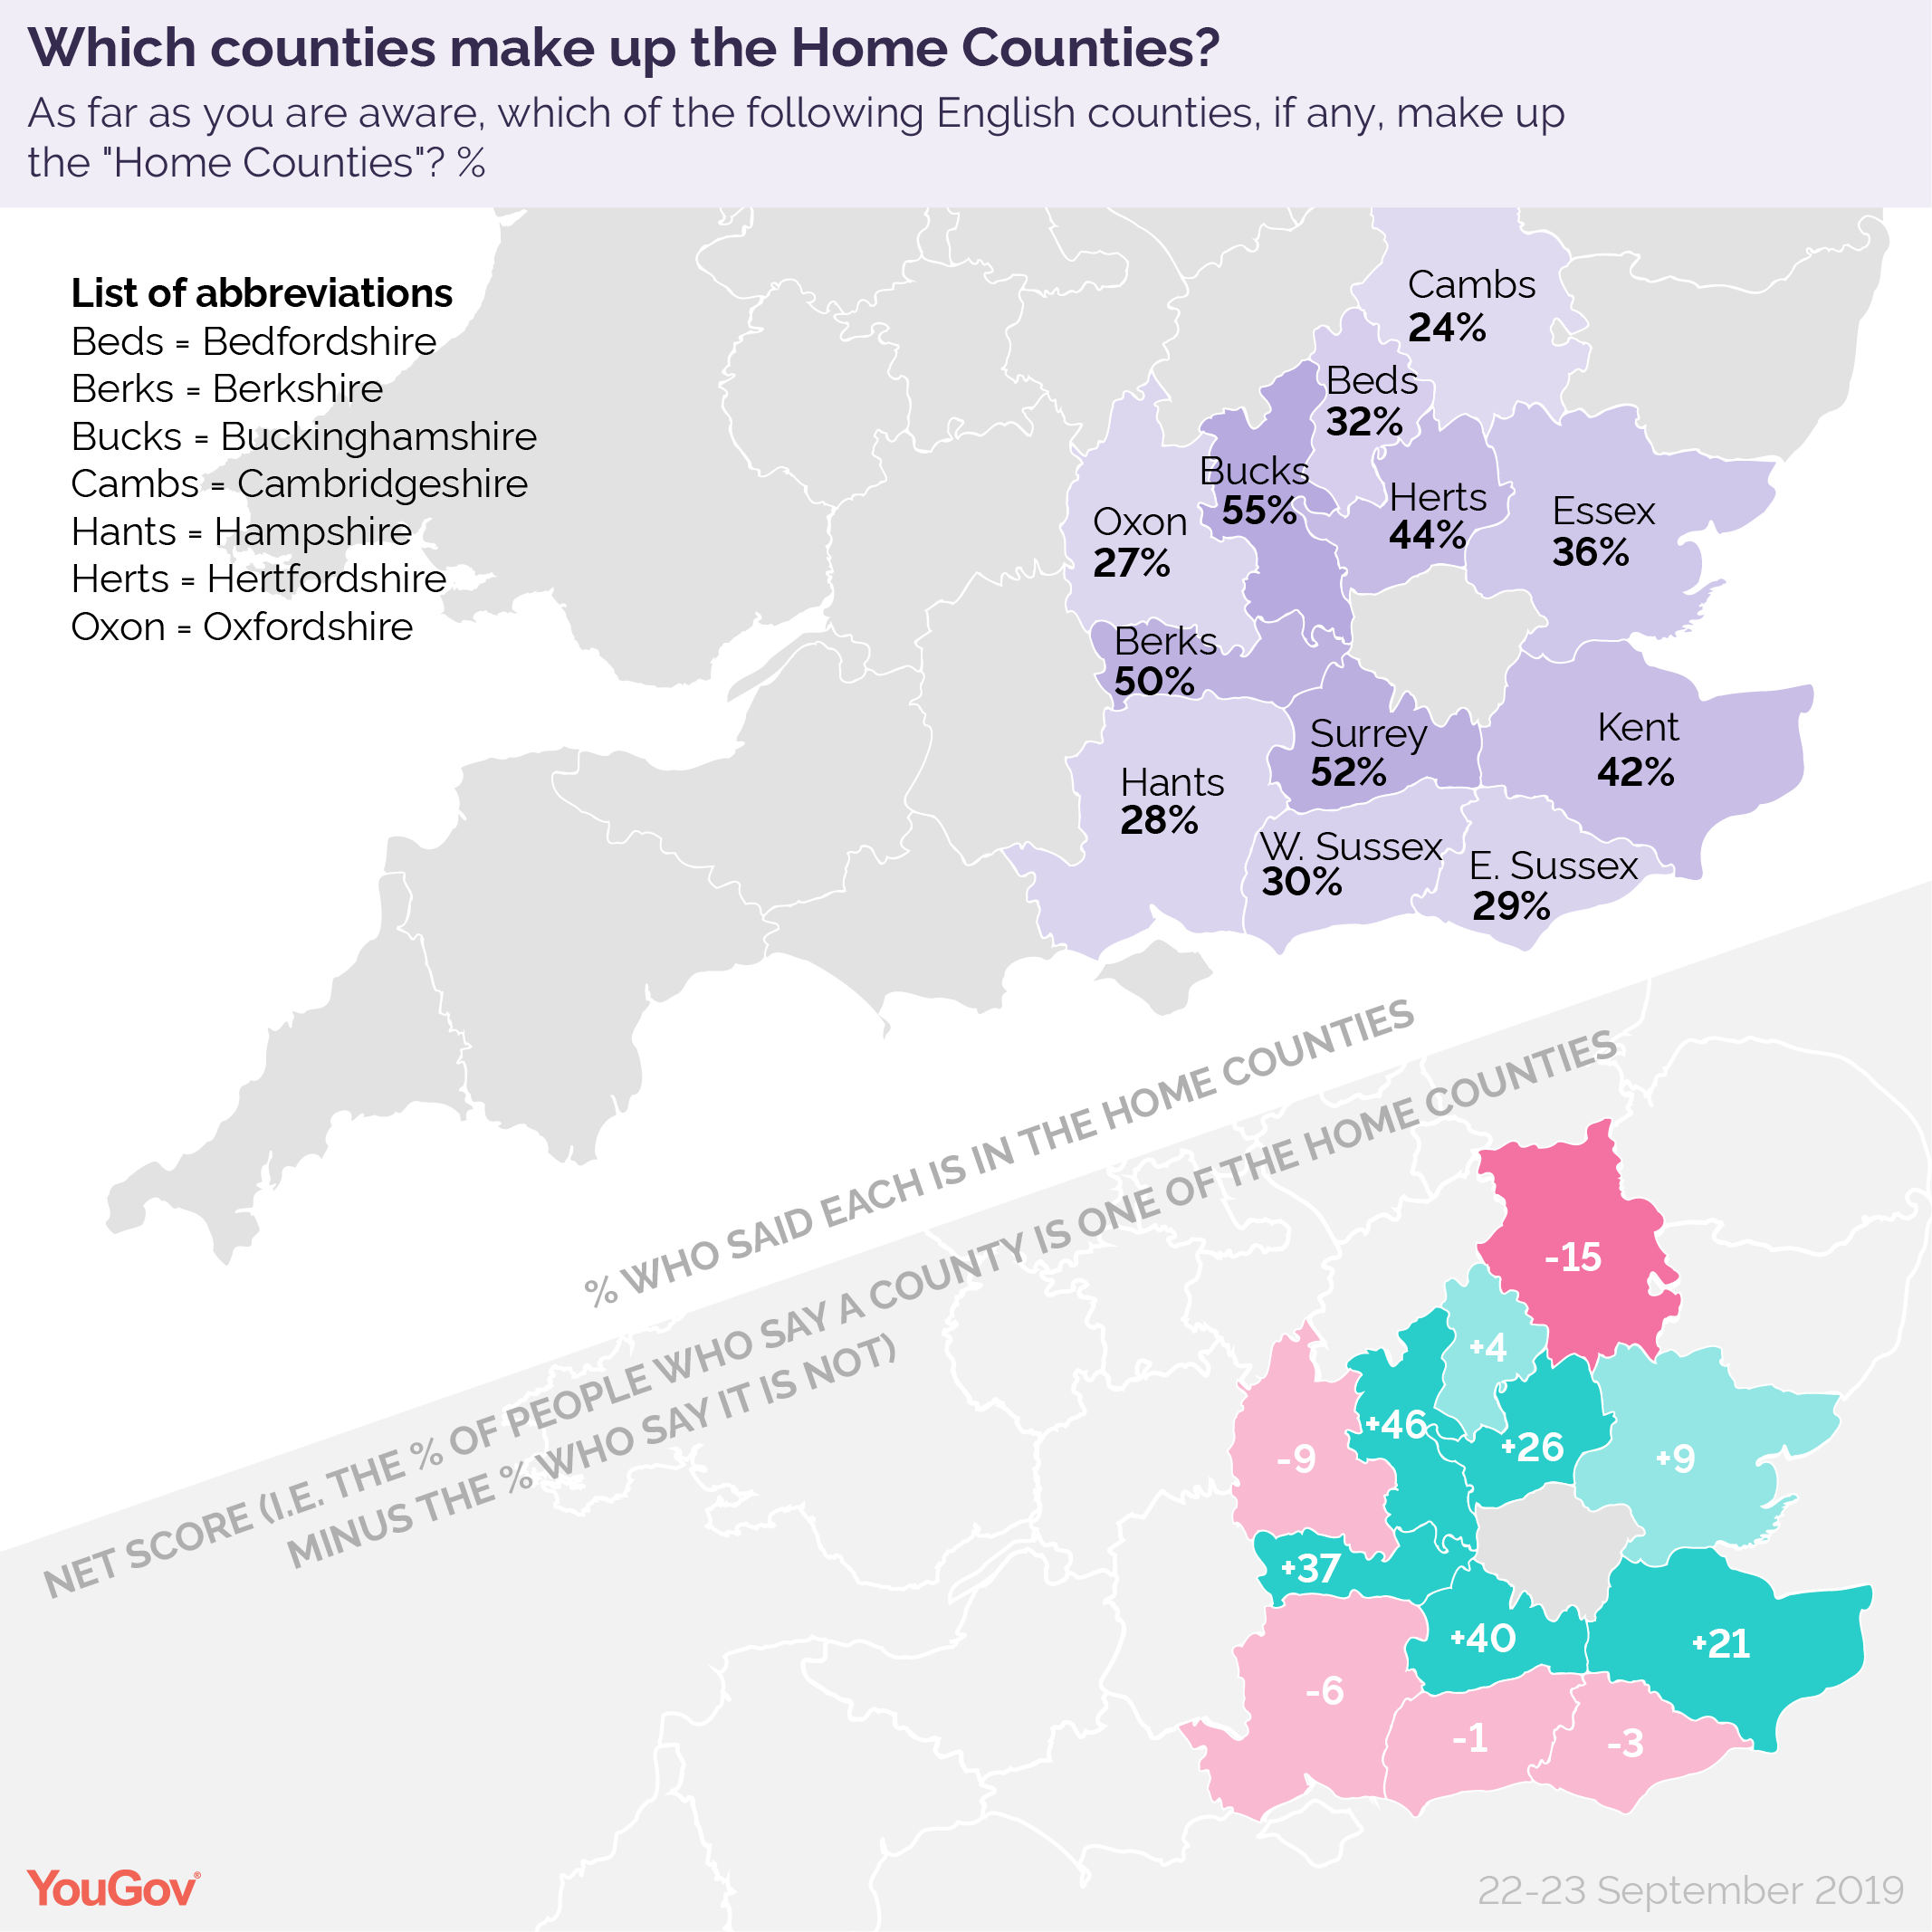
While most historical and cultural references to the term also include Sussex, few people regard the two counties that make up that area as being among the Home Counties. Only 30% of Brits included West Sussex, and just 29% East Sussex.
Other, more expansive, definitions of the Home Counties have also included areas like Bedfordshire, Hampshire, Oxfordshire and Cambridgeshire. Relatively few Brits believe these places count: Bedfordshire was the most commonly included at 32%, with Hampshire on 28%, Oxfordshire on 27% and Cambridgeshire on 24%.
Although it does now contain one of the former Home Counties – the gobbled up county of Middlesex – London itself has never historically been considered a Home County. Nevertheless, 29% of Britons include it in their definition.
Using net scores makes the Home Counties' borders more apparent
Because of the high number of don’t knows, most of the options were considered Home Counties by fewer than half of people. This fact can disguise, however, the possibility that those who did express a view largely backed the Home County status of some of the candidates.
It becomes helpful therefore to look at each county’s net score to determine how good a candidate for Home County it is – that is to say, we look at how much more likely people are to say it is one of the Home Counties than they are to say it is not.
Looking at things like this, it becomes clear that there are healthy leads for Buckinghamshire (+46, that is to say, the number of people who say it is a home county is 46 percentage points higher than the number who say it isn’t), Surrey (+40), Berkshire (+37), Hertfordshire (+26), and Kent (+21).
The results also show minor leads for Essex (+9) and Befordshire (+4).
By contrast, the two Sussexes have negative net scores (-1 and -3), showing that those with a view were slightly more likely to say they are not in the Home Counties than to say they are. The further flung counties of Hampshire (-6), Oxfordshire (-9) and Cambridgeshire (-15) are also all less likely overall to be seen as part of the Home Counties.
Photo: Getty