Will Jennings, Professor of Political Science and Public Policy at the University of Southampton, examines which Brexit option is most palatable to the “median voter”
What sort of Brexit does the public want? There have been numerous attempts since June 2016 to measure public support for various options. A problem here is that they tend to impose an unfair or unrealistic choice between pairs of options, such as No Deal versus Remain or the Withdrawal Agreement versus a second referendum. Such polls do not reveal the ‘will of the people’ but rather a choice between options which often are not much liked.
Perhaps the enduring Brexit paradox is that in polls posing the three-way choice between a No Deal Brexit, Leaving with a deal, and Remaining, Remain is often the plurality winner (winning the largest share of support) but Leaving with a deal (which often wins the least support) is usually closest to ‘the median voter’ – that is the voter located at the middle of the population’s distribution of preferences.
With British politics remaining gridlocked by Brexit, the ‘median voter theorem’ – famously proposed by US political scientist Anthony Downs – suggests that finding the option most palatable to the median voter could unlock electoral success for the side that adopts it. At a minimum it might help alleviate the UK’s deep political divisions over Brexit.
To try and find this mythical voter, it might in theory be possible to ask people where their preference for Brexit lies on a scale from 0 to 10, where 0 is No Brexit (Remaining) and 10 is No Deal (the hardest, most immediate Brexit). We could then plot the distribution of preferences and calculate where the median voter lies. While it might be appealing to measure preferences on a scale like this, such an approach would be highly problematic as how respondents would interpret it would be open to much doubt. If 0 represents Remaining in the EU, what does 1 represent? What does the mid-point, 5, of the scale correspond to? Half in and half out?
We can instead think of a set of Brexit options that range from ‘hard’ (No Deal) to ‘soft’ (Remain, or remaining a member of the Single Market and Customs Union). We can then ask respondents whether they consider each option a very bad outcome, a bad outcome, an acceptable compromise, a good outcome or a very good outcome (respondents who are unsure are not assigned a score), assigning these a score from -2 for very bad to +2 for very good. The idea is that we are measuring the intensity of support for particular outcomes. Simply taking the average score for each option is revealing in itself.
Firstly, none of the options has an overall positive rating. This truly is a negative sum game for the UK government and parliament. No Deal is viewed most negatively on average (with an average score of -0.61 on the scale), followed by Theresa May’s negotiated deal (-0.45). The softer options of remaining a member of the Single Market and Custom’s Union and holding a Second Referendum and voting to Remain are neck-and-neck as the least unfavourably viewed options, both being on -0.07 (the difference between them is statistically insignificant). These headline figures do not tell the whole story, however…
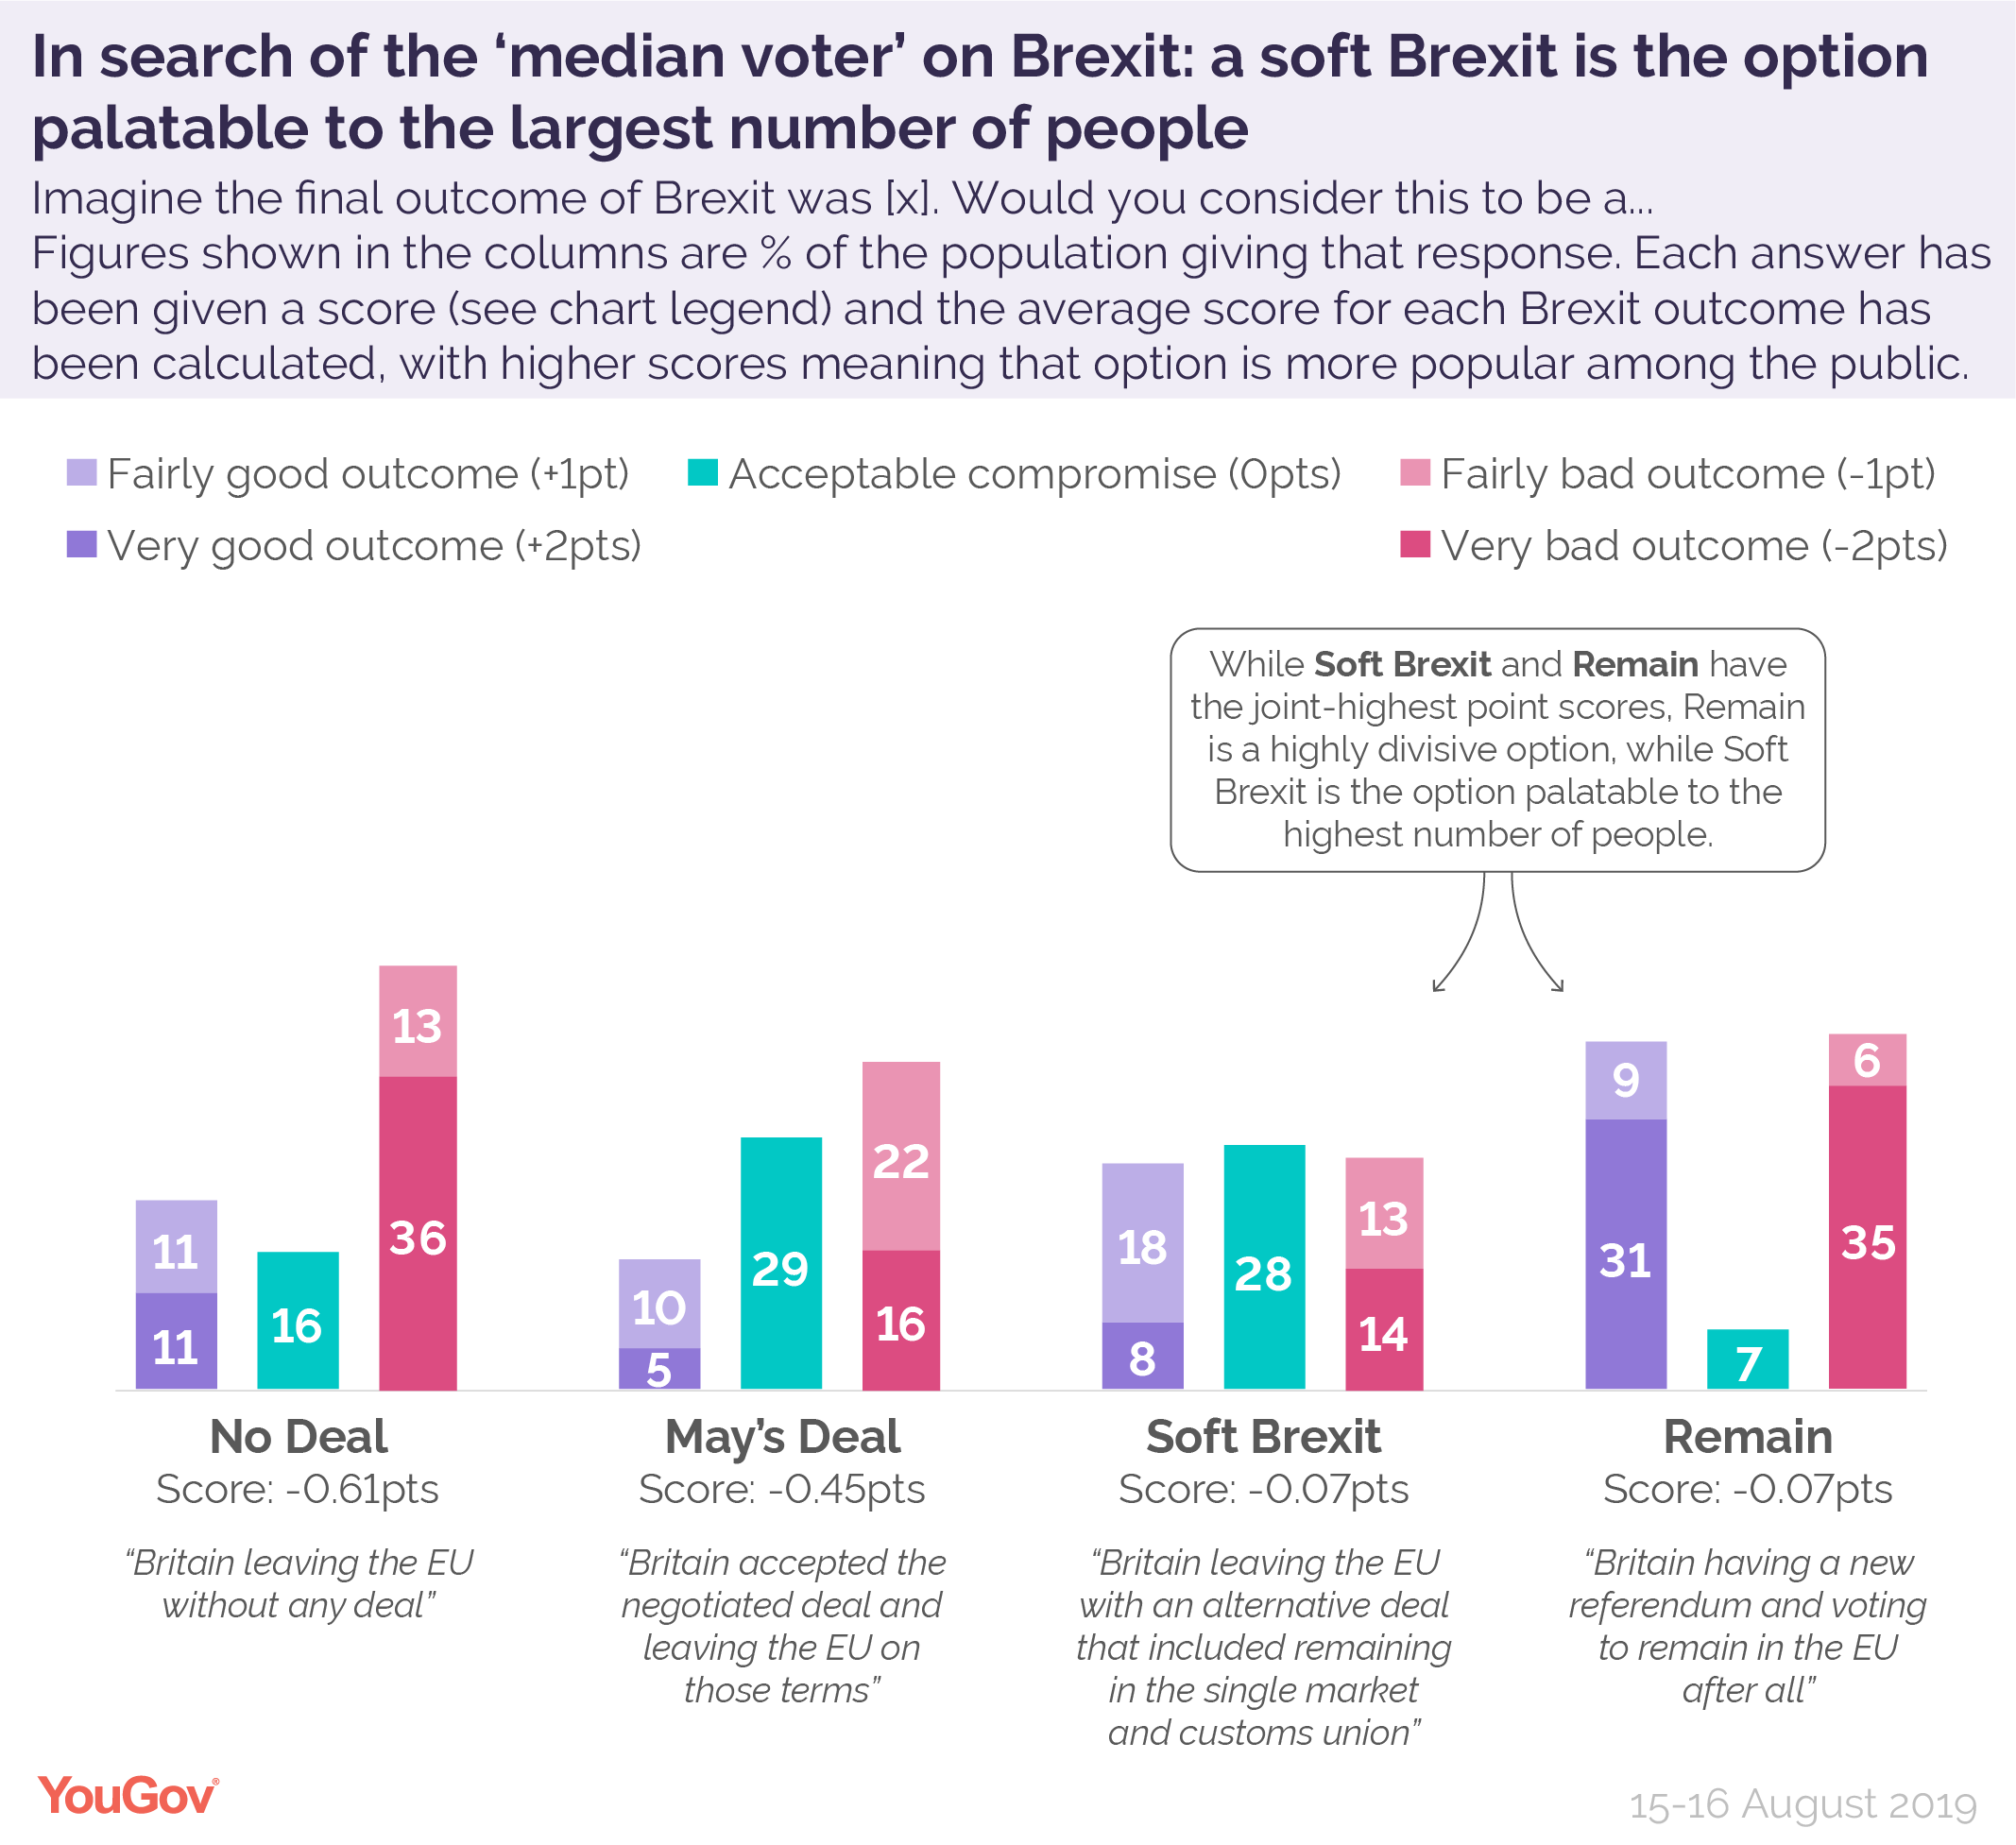
If we instead consider the distribution of preferences, from most negative to most positive, we see that there is considerable difference in the nature of support for each type of Brexit (respondents who are unsure are retained in calculating the proportions, though are not plotted in the figures). For No Deal, it is clear that a substantial portion of the public (just under 50%) consider it a very bad or bad outcome. Of those expressing an opinion, the median voter considers No Deal to be a bad deal.
In slight contrast, while the negotiated withdrawal agreement remains unpopular, with two out of five respondents considering it a bad outcome, opposition is much less intense (the number saying it is a very bad outcome is less than half that for No Deal), while approaching three in ten respondents consider it an acceptable compromise.
A Soft Brexit that would see the UK remaining in the Single Market and Customs Union is also considered to be an acceptable compromise by a similar number of people (28%), while just over a quarter of people (26%) consider it a good or very good outcome. Based on the distribution of preferences, this is the option where public opinion is least divided (i.e. it has the lowest proportion of respondents considering it either very bad or very good) and there are fewest losers – with just 27% of people considering it a bad outcome (including just 14% deeming it a very bad outcome).
While we saw earlier that the average score for Remain was about the same for the Soft Brexit option, public attitudes to the two are very different. Where a soft Brexit is palatable to many, Remain is incredibly divisive with around 35% considering this a very bad outcome and 31% considering it a very good outcome. Just 7% consider Remain an acceptable compromise. This suggests that a second referendum and voting to Remain would be far more polarising than the option of Single Market and Customs Union membership.
Why then has Brexit not delivered the outcome seemingly preferred – or least hated – by the median voter? One explanation is that there is substantial uncertainty around what the public want from Brexit. Designing survey questions about the possibilities is not straightforward, while the choice on the ballot paper did not – despite what many claim – designate what precisely ‘Leave’ amounted to. Downs’ original theorem also assumed that the distribution of voters’ preferences was ‘single-peaked’ – but the options of Remaining and No Deal each deeply divide opinion.
Both major parties are pushing strategies that are not aimed at the median voter. There clearly is no popular mandate for the option of No Deal that has been toyed with by the Conservatives (before even any ill effects of crashing out of the EU are felt), while the second referendum that Labour has proposed (after much dissembling and prevarication) would be deeply polarising – leaving a large number of people either very happy or very dissatisfied – and little middle ground in between.
In some contrast, the option of retaining Single Market and Customs Union membership is seen as an acceptable compromise or better by the largest number of people – nearly 6 in 10. That this option is nowhere close to the political agenda right now tells us a lot about how pervasive populism is now in British politics. Parties’ fear of being outflanked by disruptive challengers (by the Brexit Party on one side and by the Liberal Democrats and Greens on the other) are pushing the Conservatives and Labour to untenable positions that risk alienating large numbers of voters.
Photo: Getty


