

Phone polls have too high a percentage of graduates – YouGov's online polls don't
Anyone trying to predict the result of the EU referendum will be well aware of the discrepancy between online and phone polls and will therefore be struggling to make sense of exactly where we are – is it neck and neck or does ‘remain’ have a strong lead? YouGov has conducted important new research into this including a dual methodology survey. Below we outline our views on what it shows and hope it generates serious discussion. We will release all the data from these two surveys including questions aimed at testing sample quality such as ‘supermarket shopped at’ and levels of watching certain TV shows (which can be compared to other kinds of data) allowing others to draw their own conclusions. YouGov’s conclusions are taken from our data and the data that we can see from other companies. If those companies would do what we do today, and make all their data available, then it will mean the industry can work together to be certain we completely understand what is really happening.
Theories have abounded but nobody has been able to settle on one – it has been suggested that it is harder to reach social liberals but there is no evidence of that and indeed what evidence there is, from the 2015 General Election, points in the opposite direction. At YouGov we have wondered if there is a shy-Brexit factor on the phone that does not play out online but our experiments into that have not found anything.
Now however we can reveal a real, significant and evidence-based difference between the two methodologies that explains why they are divergent and why it is online that appears to be calling it correctly. After looking into other published polls and conducting our own dual method experiment we have identified substantial differences in sample composition between the two methodologies.
There are some major demographic correlators with how people intend to vote, for example age, social grade, and geography, all play extremely important roles but there is no driver more important than education. The longer time spent in education, the more likely you are to vote ‘remain’ (see table of results from the YouGov online/phone experiment below).
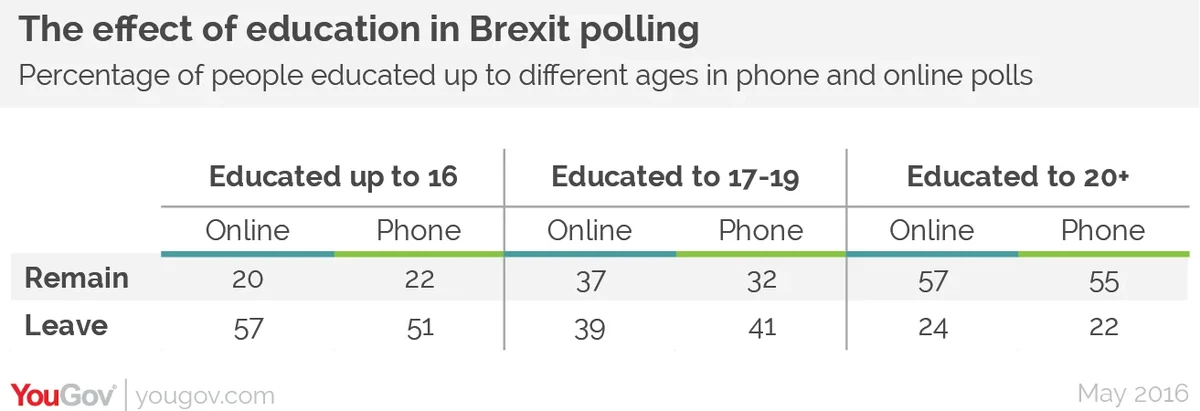
So any differences in the education levels between samples would have a major effect on the overall poll lead. And a YouGov investigation has revealed that there are indeed major differences between samples.
In their phone polls in February and March Populus asked about the highest level of education attained by the people in their sample. In February they found 44% with a degree or higher and in March that was 46%. By contrast, since we fixed the problems that we – along with all pollsters – had with GE15, in YouGov online polls that number is less than 30%.
The census and annual population studies give varying estimates of the proportion of people with a degree but it is in a range of 27% to 33% for 16-65yr olds (less for the population as a whole), much closer to the YouGov online figures than the phone ones. So the phone polls had far too many people in the group most likely to vote ‘remain’. Without access to the full Populus data it is impossible to reweight the data to match that breakdown but a simple calculation, adjusting the data to match those proportions suggests that a split of 48%-37% in favour of ‘remain’ in the February poll would become a ‘remain’ lead of just 1 to 4 points, ie the virtual tie that we are seeing in online polls. The March figures are less dramatic, driven by a more even split amongst secondary school leavers (perhaps suggesting that within that group there were too many 18/19yr old leavers and not enough 16/17yr old ones). Nevertheless the Remain lead is cut from 14 points to 7-9 points in this poll. Populus do not split out the groups below degree level but their data on how those with degrees are voting shows a very similar split to the ones we are seeing (59%-26% in March and 55%-30% in February) suggesting it is not views within the groups that differ between methodologies but the proportions of the groups themselves.
Is this a common thread that runs through phone polls or just a feature of those Populus ones? Unfortunately other phone companies don’t ask that question, or at least don’t reveal it, so it is not possible to be certain but given the results we see from phone polls and the importance of education in how people vote we can relatively confidently infer that is the case. Another facet of the Populus polls that we can see repeated in other polls, for example the most recent ICM one, is a very high number of people in social grades AB in the unweighted sample. This group is then weighted down but it seems possible that phone pollsters are finding it easier to reach better off and better educated demographics and that this might be reflected beyond the weighting – ie the C1C2DE respondents that the phone polls do find are more like AB people than average.
To test this theory further YouGov conducted its own phone poll, as well as running a simultaneous online poll. We took into account the concerns we have about phone samples, conducting the poll slowly over two weeks, making sure we continued to call the same numbers rather than moving on to new ones so there is no bias against those less likely to be in, doing everything we could to achieve a more representative distribution of education levels. This gave us a starting sample much more in line with the census statistics on education than Populus have found (in fact the raw sample was very slightly less educated than the population as a whole) and we also applied an education level weighting to ensure a perfectly representative sample on this*. As online researchers we know so much about our panellists that we can carefully and quickly identify a representative sample. To get such representativeness on the phone requires going back to the same numbers until they're in. This is a key feature of the gold standard BES/NatCen studies, but impossible with fast turnaround phone polls (and unnecessary in online polls that draw from a pre-understood panel).
This experiment revealed a dramatically different result compared to what we have seen from other phone polls.
The online poll had a two point Leave lead with 40% saying leave and 38% saying remain. And the YouGov phone poll had a three point leave lead of 39% to 36%.
This result is extraordinary but not, on reflection, surprising. As we saw earlier, sample composition on education level is absolutely fundamental to referendum polling. With phone polls under-representing the less well educated so dramatically it is not surprising that they are skewing towards ‘remain’. The online polls are doing a better job of finding representative samples and therefore a better job of representing the views of the population.
Does this mean we can now predict the result? No, it means we know what people are saying today. Two factors will be crucial:
1. Turnout
Turnout will be vital – ‘leave’ has an enthusiasm advantage which may help them but the biggest supporters of ‘remain’ are the more highly educated, the group traditionally most likely to turn out. This latter point is to some extent reflected in the results with greater levels of ‘don’t know’ and ‘would not vote’ in the less educated groups. But on the day there may be an even bigger turnout differential. Joe Twyman will be delving into the potential impact of differential turnout in a later article.
2. Risk aversion
We have also seen in past referendums, most notably the Scottish Independence Referendum in 2015, (in which we tracked individuals and saw a significant fraction changing their minds in the last days) that there tends to be a late movement towards the status quo. YouGov’s latest poll for The Times shows a 4 point lead for Remain. That was conducted more recently and could be showing the start of a trend, or with the changes within the margin of error, could just be statistical noise. We will need more polls before we can come to a conclusion on that.
So there is still plenty of time for things to change and the purpose of opinion polls is to show what people are saying now not predict the future (that is better left to the betting markets). We don’t want to shirk our responsibility to give a view though so when forced we would argue that the history of referendum campaigns means that we still believe Remain will prevail in the end. The one thing we can say for certain is that right now it is very close and if you see any poll that suggests otherwise your first question should be, ‘what is the education make-up of the sample?’ A failure to include this variable is likely to produce significant error.
As mentioned we are making all our data from these two polls available – extensive excel tables as well as the raw, individual level data in CSV format with a codebook – in links below later today. We believe the theory outlined here to be correct and explain why we are seeing such differences between phone and online. We believe that the other questions around sample compensation help to prove that (‘main supermarket’ and ‘TV shows’ watched for example). But interrogate it, challenge the sample, draw your own conclusions. We think we’re right and you’ll want to know that. If you have reasons to believe we are wrong then we want to know that too.
*note we used age finished education which is slightly different from the Populus question as not everyone who is still in education at 20 gets a university degree.
Methodology note
YouGov is an online research agency and so commissioned a telephone agency to run the fieldwork for our phone poll. YouGov commissioned Feedback Market Research and they employed standard telephone research methodology for this poll. Data was collected over a significantly longer fieldwork period than typical telephone polls (two weeks). Phone calls were made between 9am and 9pm Monday to Sunday. Feedback Market Research generated numbers to call based on the standard procedure of taking a number from the phone directory and then randomising the final digit. Respondents were called back up to three times if they could not be reached on the first call. No quota samples were included and 73% of respondents were surveyed via a landline with the remainder coming through mobiles.
Results
All links download as Excel or CSV files to your computer:
See the full online poll tables / phone poll tables
See the full online poll codebooks / phone poll codebooks
See the full online poll raw data files / phone poll raw data files