
On the face of it, two big things have happened to Britain’s voting habits since 2010: the Liberal Democrats have lost votes, mainly to Labour, while the Conservatives have lost votes, mainly to UKIP. In a sense this is true, when one looks at the net changes in each party’s support. But it is also misleading, because it ignores a whole raft of changes swirling below the surface.
Want to receive Peter Kellner's commentaries by email? Subscribe here
This matters. Two statements I have heard frequently in recent times go something like this:
- “Anyone who voted Labour in 2010 must surely be a rock-hard loyalist. If they stayed with the party when the economy was in a mess and Gordon Brown was leader, surely they can be counted to vote Labour in 2015.”
- “There is no way the Tories can add to their 2010 total. They had everything going for them – a popular leader and discredited opponents. After five years of government and the inevitable disappointments, surely their support can only go down.”
The trouble with both statements is that they are usually made by people who are intensely interested in politics and move in circles where most other people are, too. They cannot imagine people who have switched from Labour to Tory since 2010, or from Lib Dem to UKIP.
In fact, normal people are less predictable than political junkies think. Most are less interested in politics; millions of voters have weak and fluctuating allegiances. That is why the two statements quoted above are wrong. Yes, Labour’s total vote will probably be higher next year than in 2010, and the Tory vote probably lower; but neither is certain. The outcome will depend on net movements in votes, and each net change is simply the difference between two, often much larger, gross movements in support,
To throw light on this, I have combined the results from all the voting intention polls that YouGov conducted in January. This gives us a total sample of more than 37,000 people. I have then compared the way they voted in 2010 with the way they say they would vote now. (For around two-thirds of the 37,000, their 2010 vote is what they told us at the time; the other one-third have joined our panel since then and we have used their recalled vote. Some of this one-third may have misremembered how they voted, but the impact on this analysis should be small.)
Here is what we found (I have made a rough estimate of the number of supporters of each party who are likely to have died since the last election):
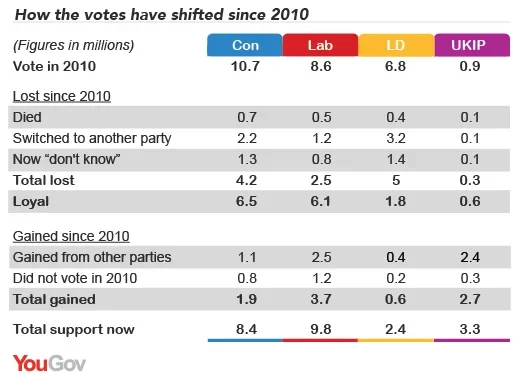
These figures tell us five key things about the state of the battle with 15 months to go to next year’s general election.
- Barely half of those who will vote next year (around 16 million out of a likely total of 30 million or so) are party loyalists: people who voted at the last election and would vote the same way today.These figures tell us five key things about the state of the battle with 15 months to go to next year’s general election.
- Labour has the highest loyalty rate, but it is far from total: 74% of those who voted Labour last time and are still alive would vote Labour today. The Tory loyalty rate is 64% and the Lib Dem loyalty rate a miserable 27%.
- As many as seven million have switched parties since 2010. Another seven million are people who either did not vote last time (some because they were too young) or did vote then and aren’t sure who they would support today.
- Of the seven million who have switched party, fewer than half have moved either from Lib Dem to Labour (1.8m) or from Tory to UKIP (1.4m). The rest are people who have moved in other ways. Half a million have shifted from Conservative to Labour, another half million from Lib Dem to UKIP, and 400,000 from Labour to UKIP. And while the Liberal Democrat vote is less than half what it was in 2010, it would be even lower without the 400,000 new supporters it has gained from other parties.
- One of the things that dents the Lib Dems’ vote share, but could be rectified, is the proportion they have lost to “don’t knows”: more than one in five, compared with one in eight Conservatives and one in ten Labour voters. One thing all the parties will be trying to do is revive the loyalties of these doubters; proportionately, the Lib Dems have the greatest opportunity. In a number of the seats they are defending, their success winning back these voters will make the difference between victory and defeat.
None of this data undermines the prospect that the two biggest questions between now and May next year will be, how many of the converts from the Lib Dems can Labour hold onto? And, can the Tories persuade the voters they have lost to UKIP to return home?
But these are not the only questions. In a close election, the net impact of a host of smaller shifts can be decisive; and the figures set out here suggest that there are plenty of such shifts – a hundred thousand here, a quarter of a million there – that could determine whether Labour or the Tories end up as the largest party.
For the parties, the lesson is: don’t target your messages too narrowly. Voters will make up their minds, and decide whether to shift or stay put, in a host of ways, some of which you may well regard as bizarre or irrational (but they will consider perfectly sensible). Don’t take any given group for granted – or assume that every member is a lost cause. And in your target seats, take care to listen to as many voters as you can; and listen hard without imposing your own agenda, for many of them will tell you things about their choice of candidate and party that you won’t be expecting.
Want to receive Peter Kellner's commentaries by email? Subscribe here